PowerApps is the perfect complement to Power BI in that it makes it very easy to update or add data to the underlying datasets that Power BI is Visualizing. You can also find a video of this here
This walk through is using the Power BI sample data.
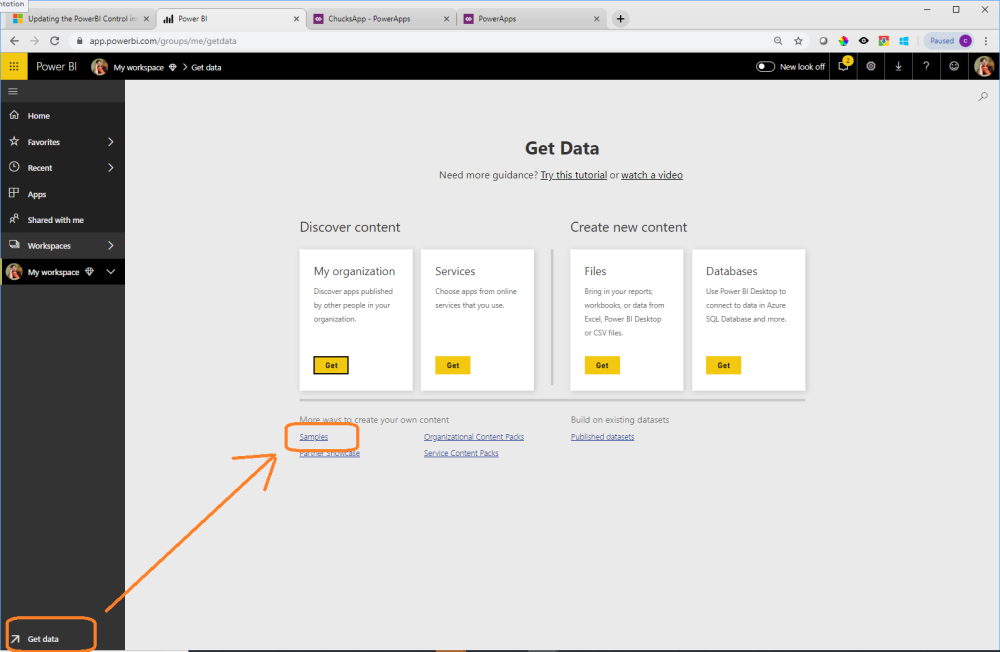
Step 1. Create a Dashboard using the Power BI Samples by selecting “Get Data” > Samples
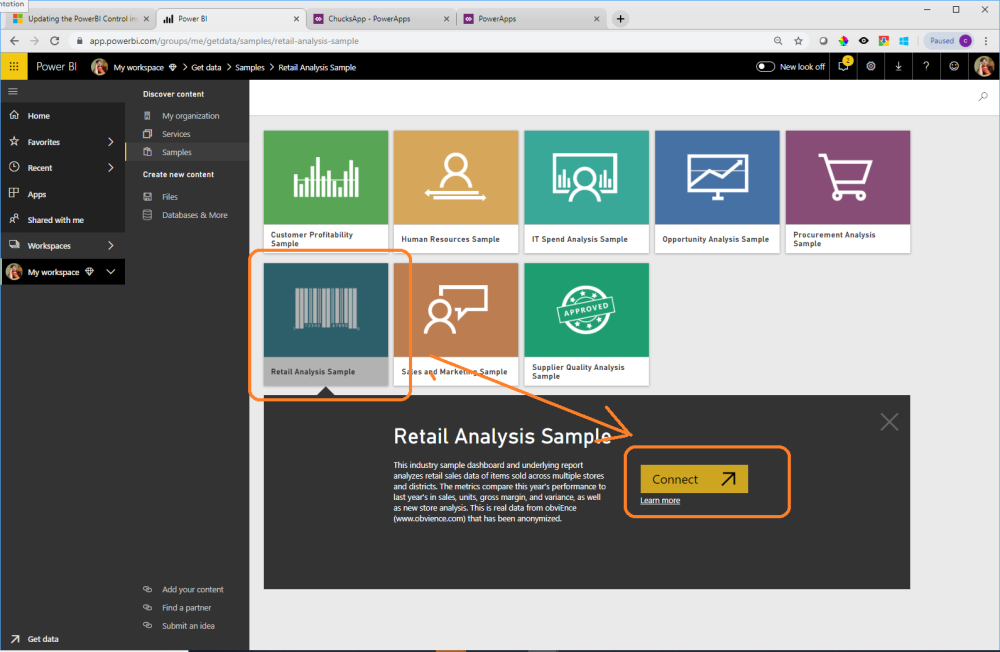
2. Select the Sample “Retail Analysis”
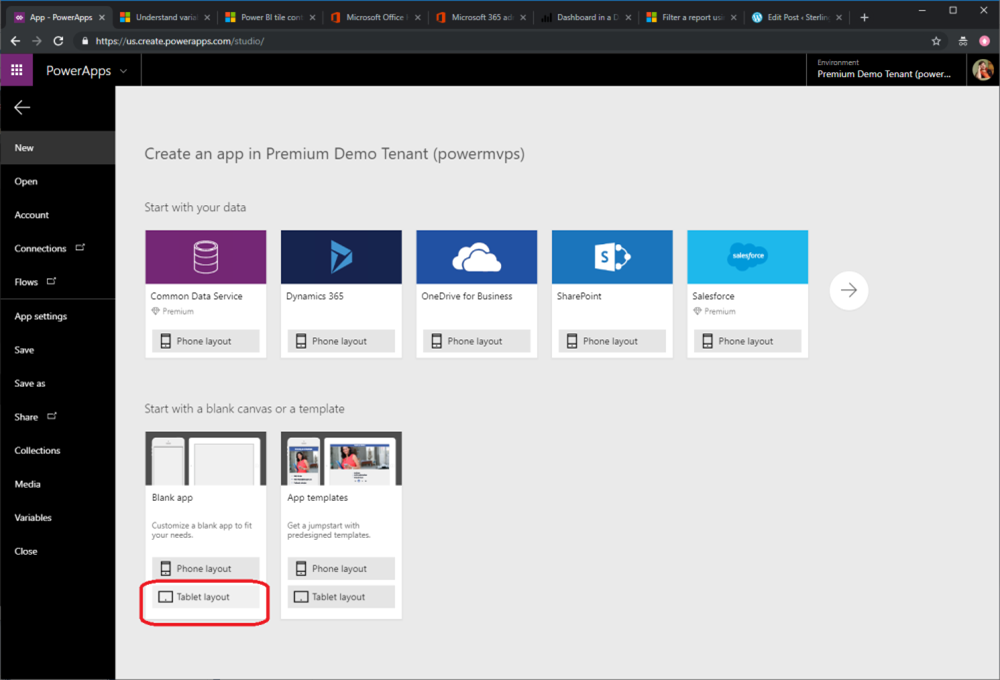
Step 3. Create a Canvas based PowerApp
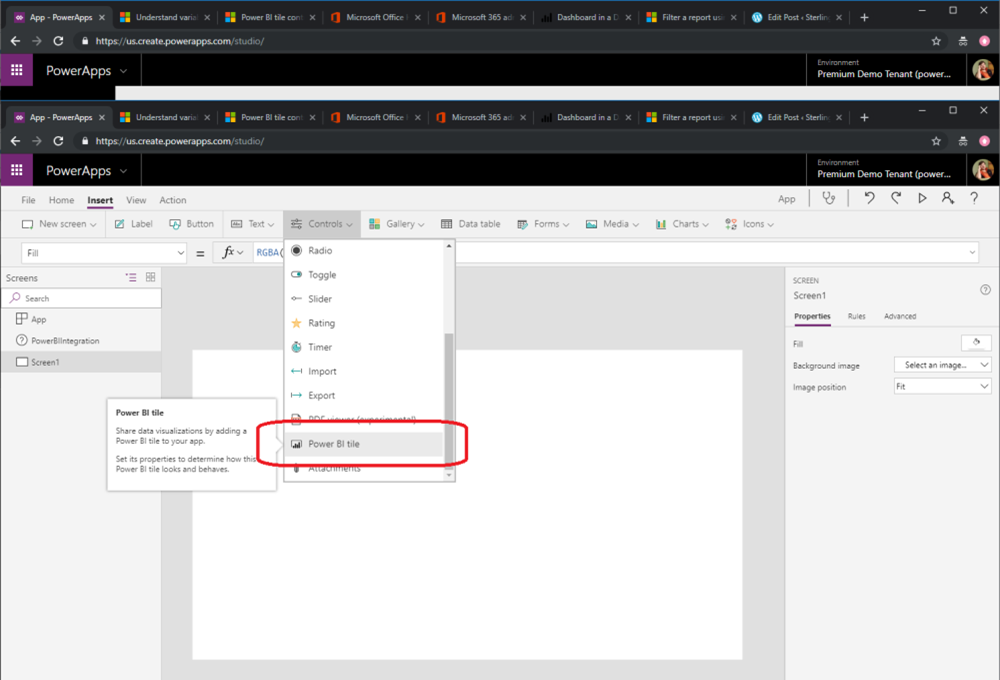
Step 4. Insert a Power BI Control
From the insert ribbon choose controls and scroll to the Power BI Tile
Step 5. Setup the Power BI Control
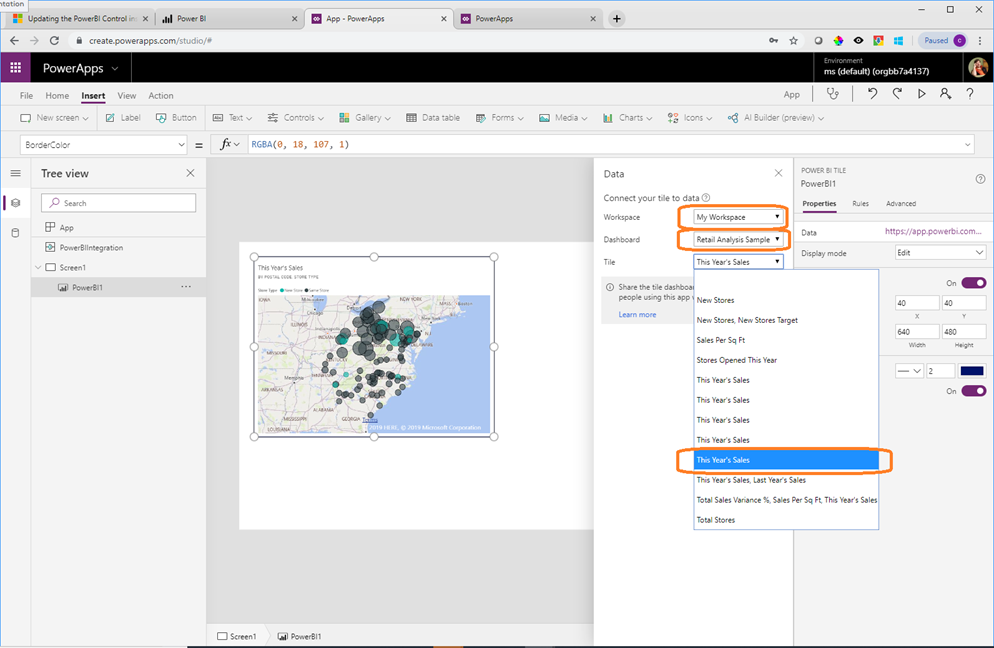
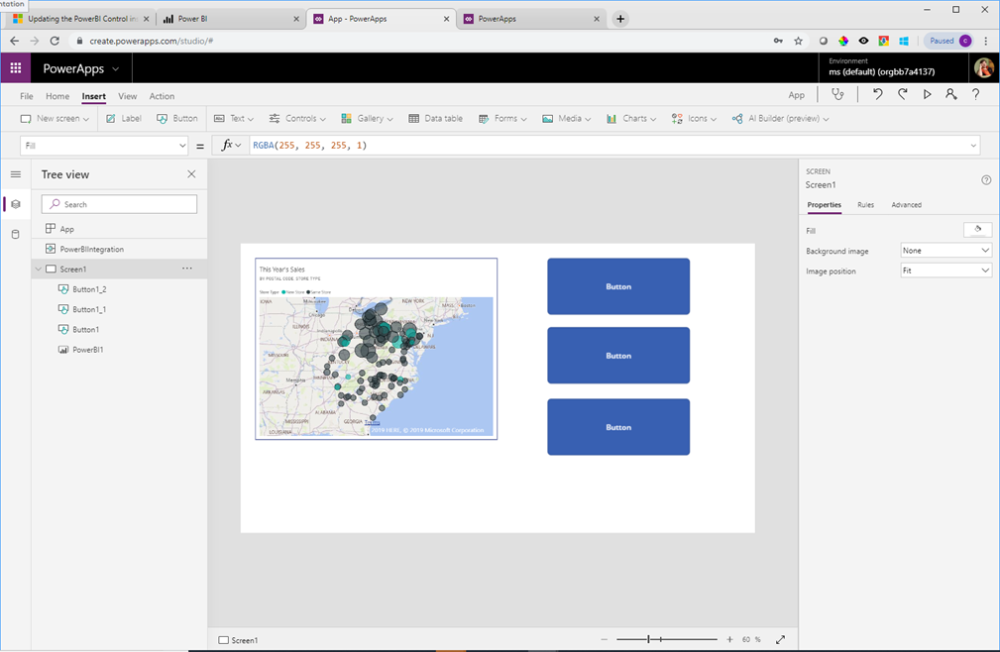
Step 6. Add some buttons to set the filter context
On the Insert ribbon select controls and add a couple (~three) buttons.
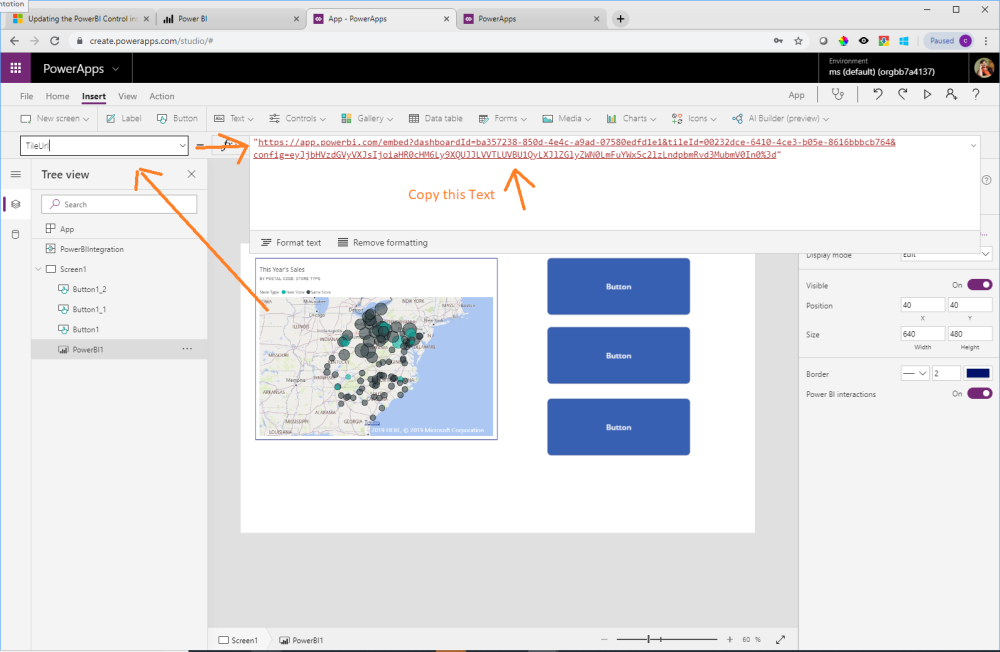
Step 7. Copy the TILE URL Text
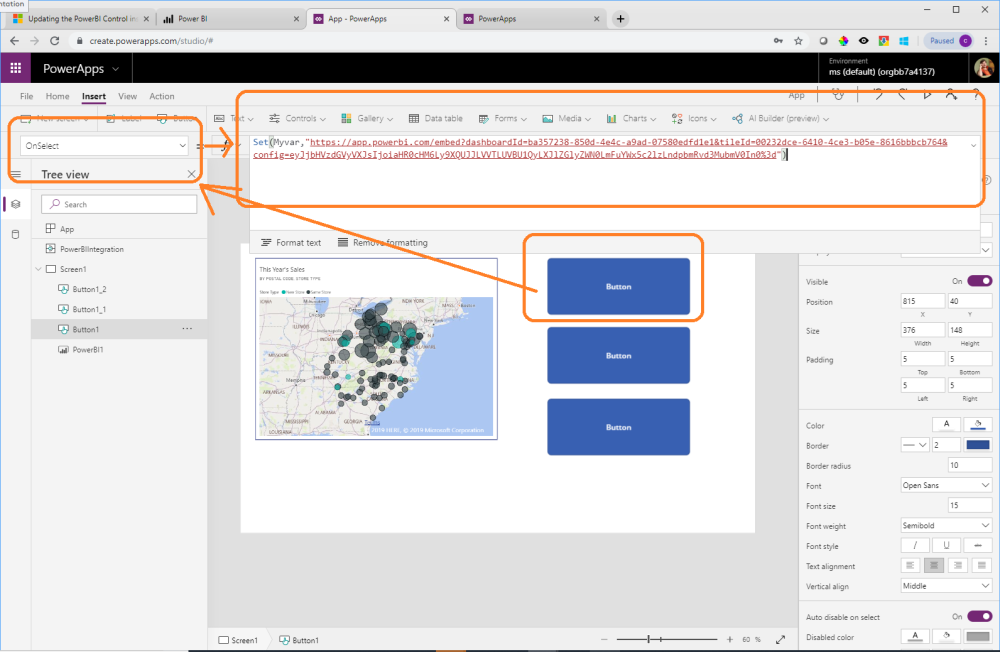
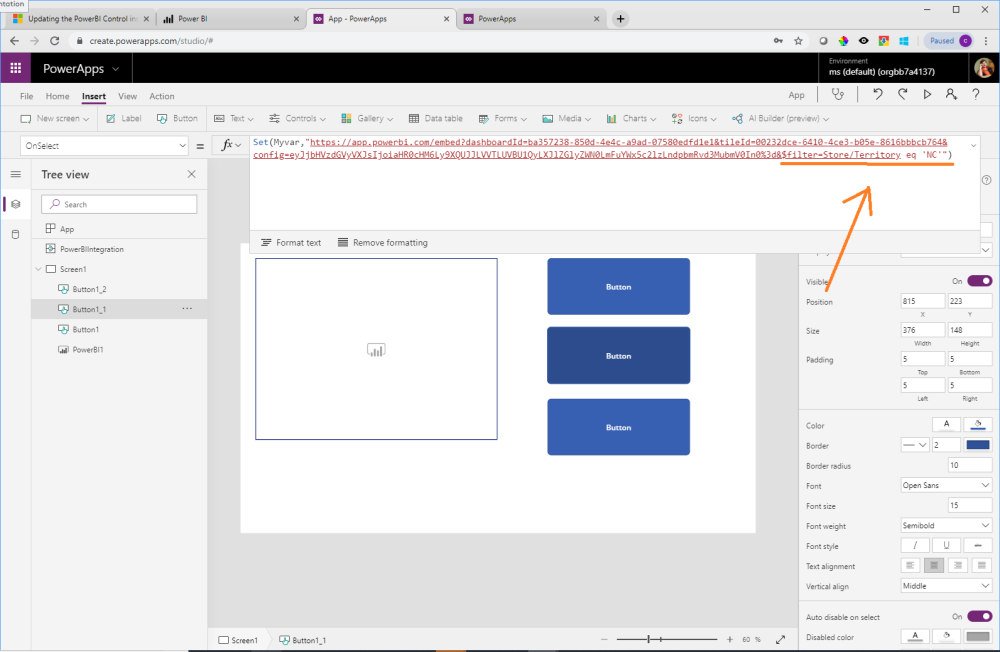
Step 8. Create and set a variable to set our visual ….and our filter context
In the OnSelect of each button set a variable to the tile URL property
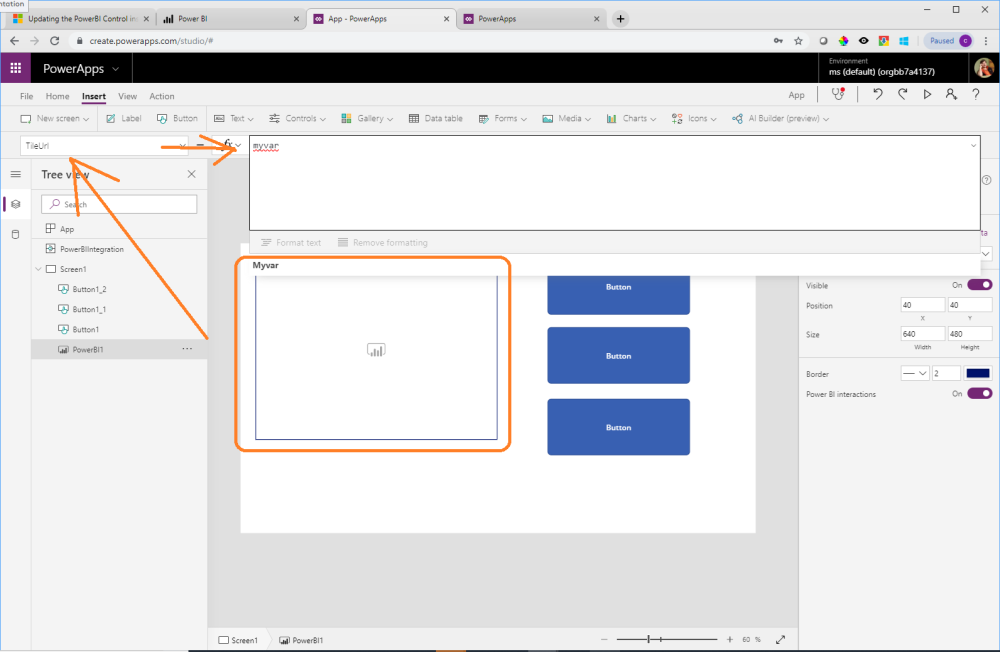
Step 9. Set the TileURL property of the Power BI Control
Select the Power BI control and scroll to the TileURL property then set the property to MyVar
Step 10 Copy this Text to the second button’s on select and add the text:
&$filter=Store/Territory eq ‘NC’
To the end
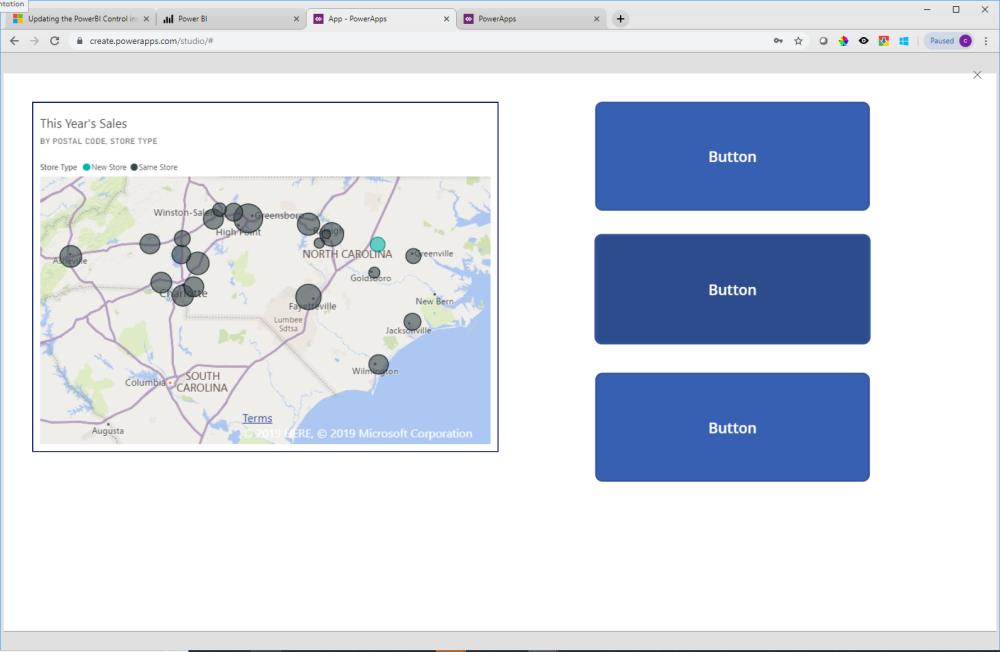
Step 11 Test the application
 Amik
on:
Dynamically translate dropdown options based on a ...
Amik
on:
Dynamically translate dropdown options based on a ...
 ManishM
on:
How do you bulk download attachment files from a D...
ManishM
on:
How do you bulk download attachment files from a D...
 on:
What you should know when recruiting for a Power P...
on:
What you should know when recruiting for a Power P...
 on:
Introduction of AI Builder in Power Automate: How ...
on:
Introduction of AI Builder in Power Automate: How ...