Hands on workshop walking attendees through integrating PowerApps and Power BI to create a scoreboard application. A video of these steps can be seen at:
https://www.youtube.com/mspowerplatform
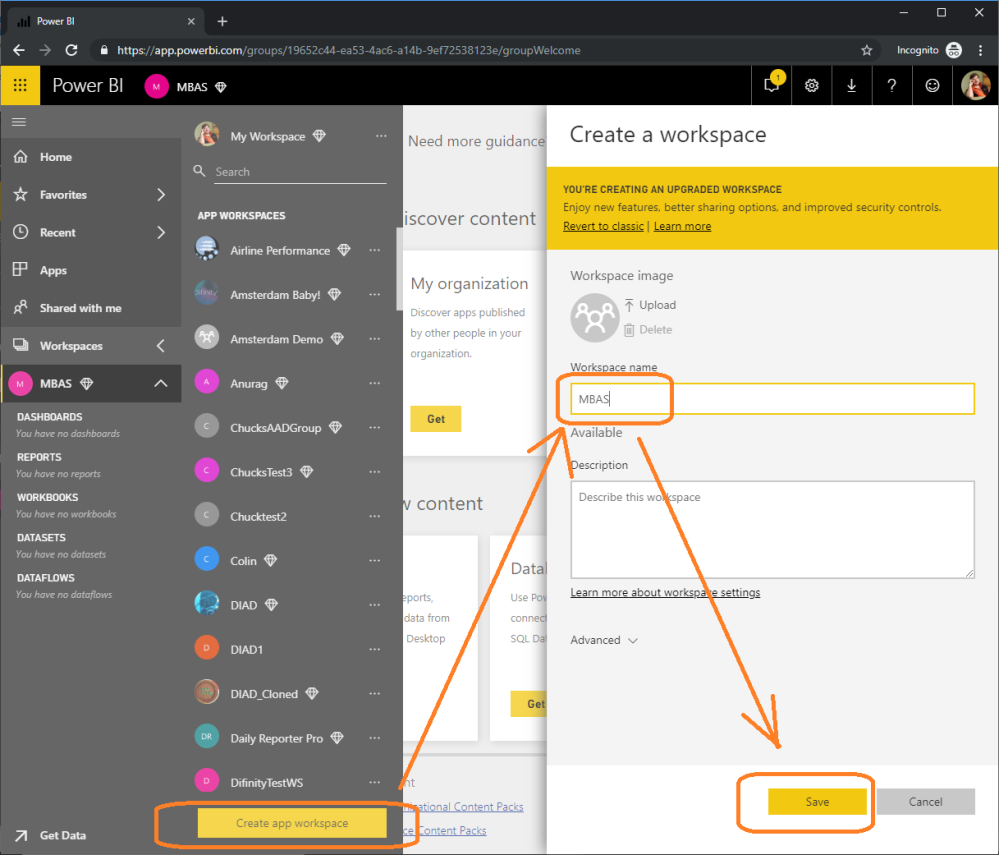
Step 1. Create an app workspace to host the application.
To do this: Log in to PowerBI.com and click on Workspaces > New Workspace.
For people doing this at Microsoft Business Applications Summit we have created accounts for you to use with the names MBASUser201@Powermvps.comthrough MBASUser400@Powermvps.com (Yes we have 200 people signed up!!) …I will give out the Password at the event.
As I used the name MBAS please name yours MBAS### with the number being your assigned account.
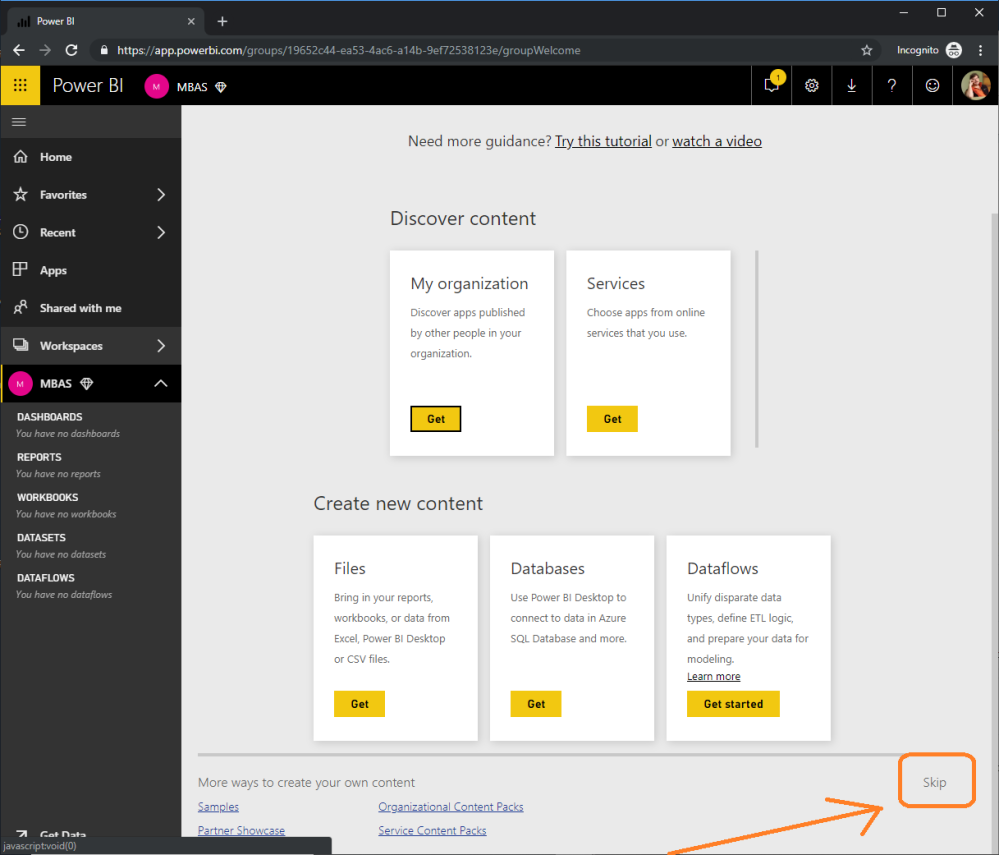
Step 2. Navigate to the Workspace content view
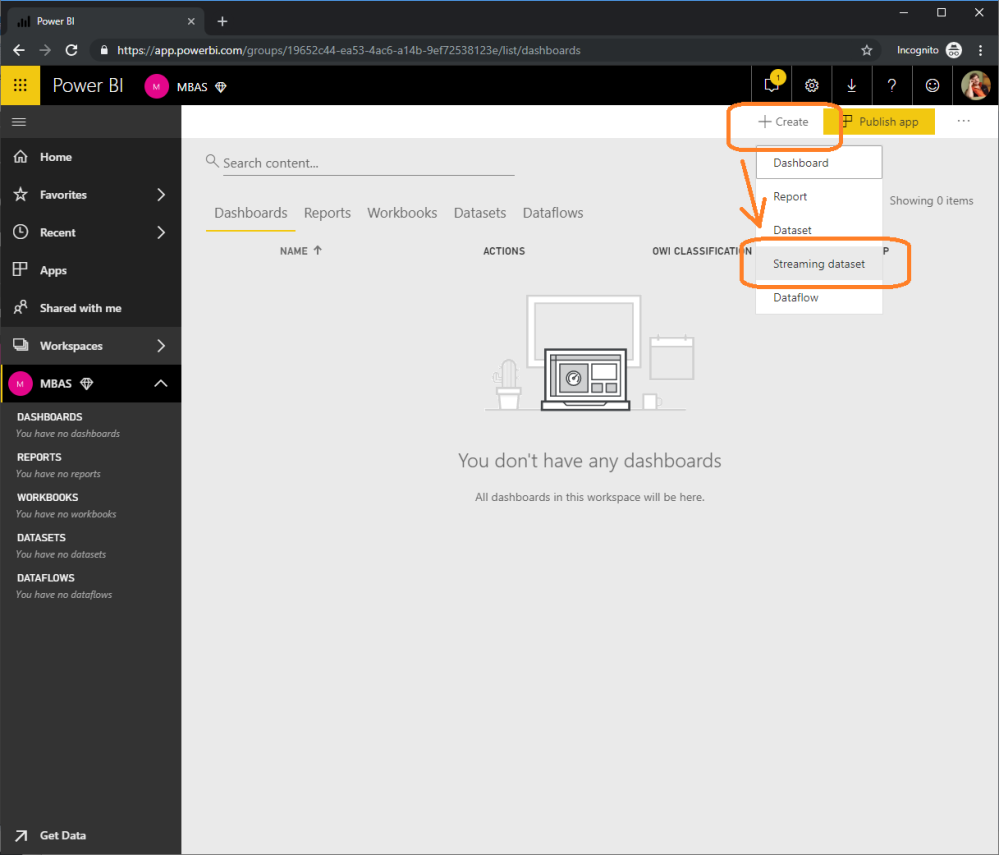
Step 3. Create a streaming dataset
Click on create and select streaming Dataset
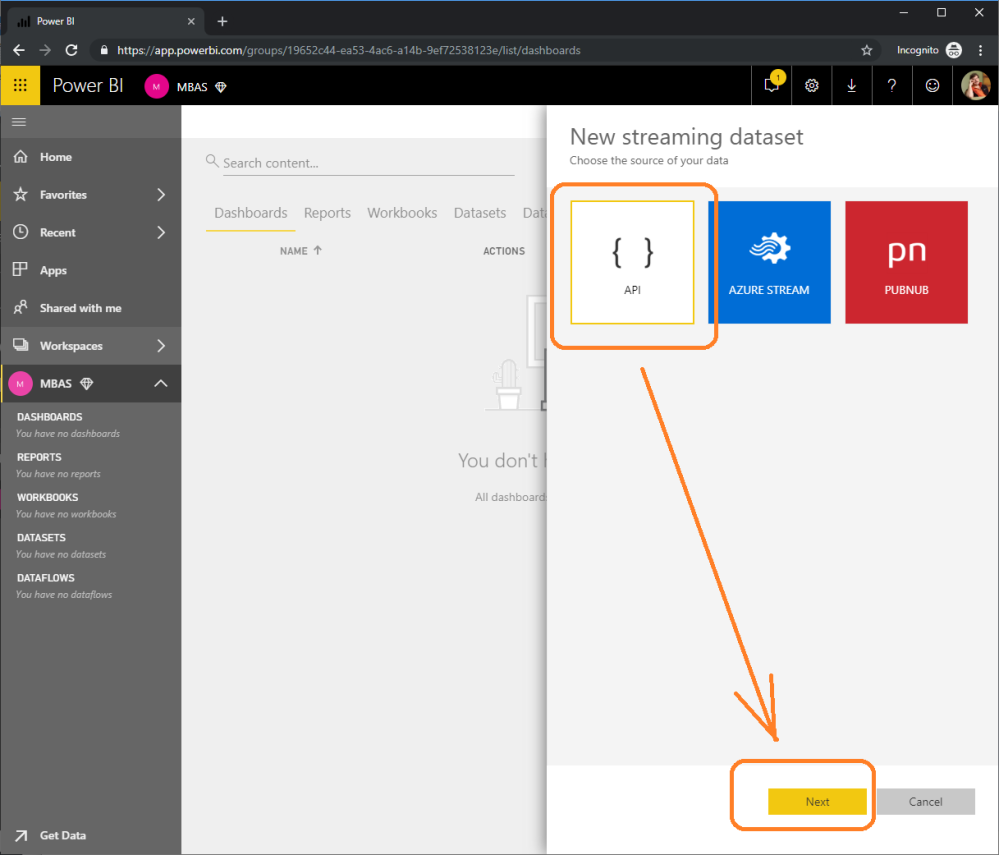
Step 4. Set the streaming dataset to be API based.
Click on API and select Next
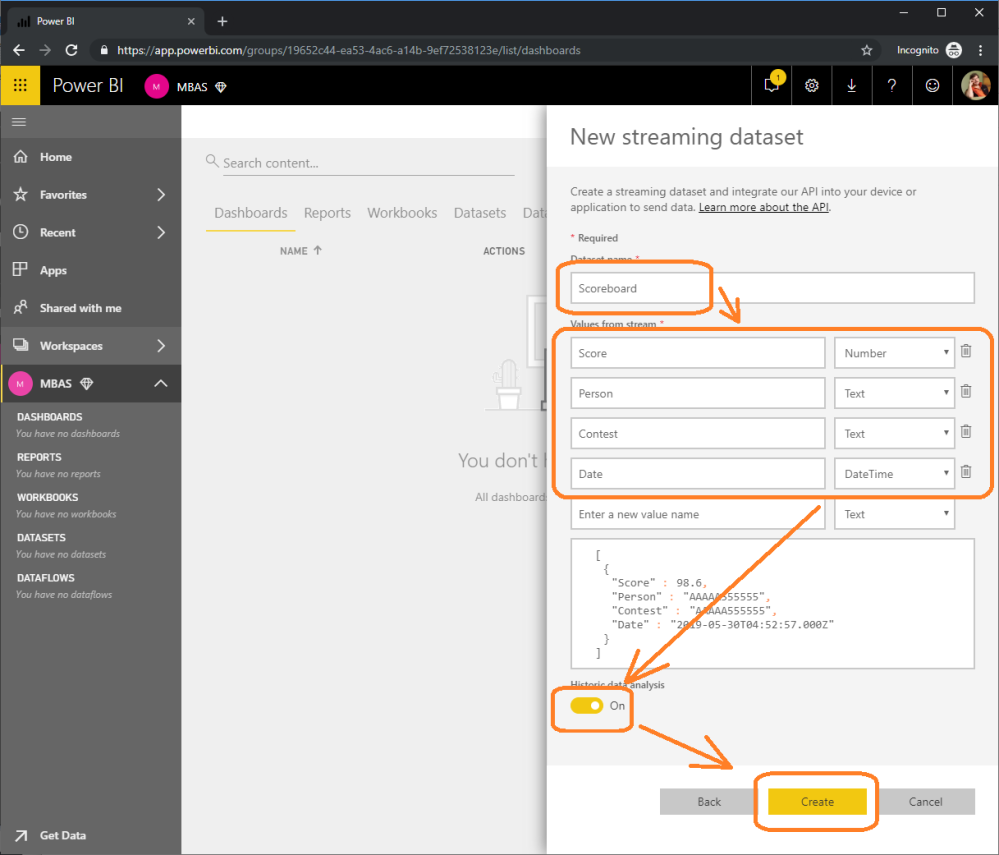
Step 5. Set the streaming dataset properties
Add the fields:
Score > as number
Person > as Text
Contest > as Text
Date > as DataTime
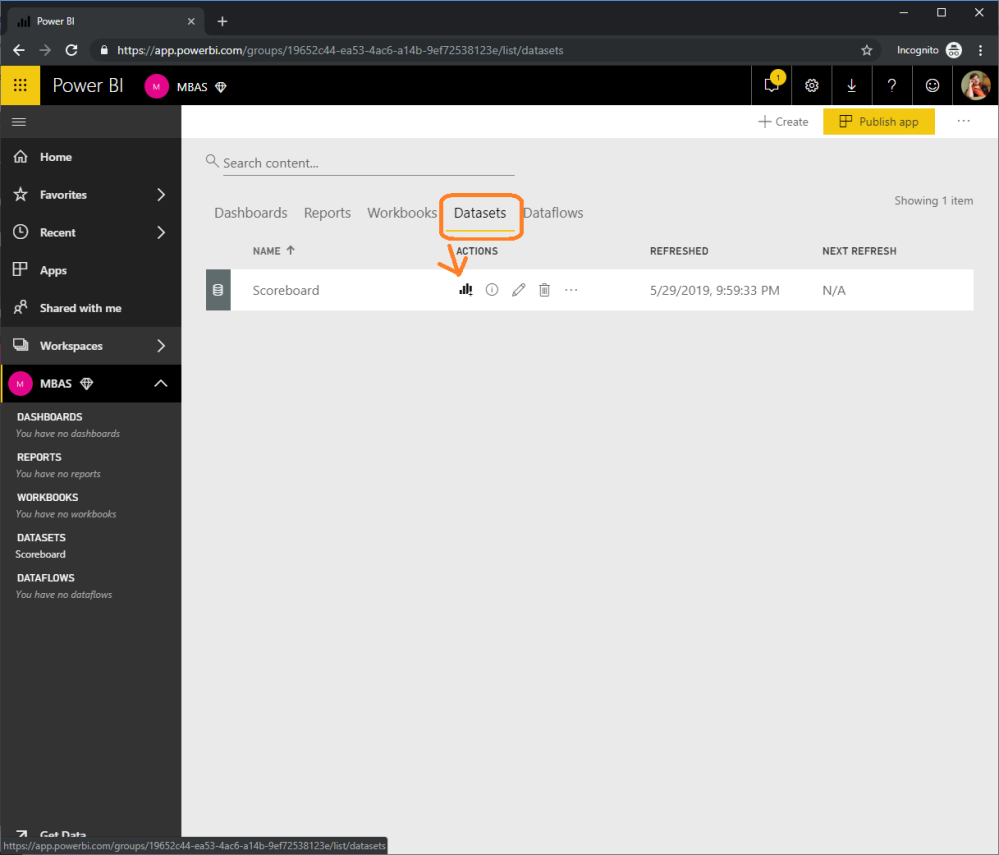
Step 6. Create a report displaying the streaming dataset
Select Datasets and then select that chart glyph for the dataset you just created in the above step
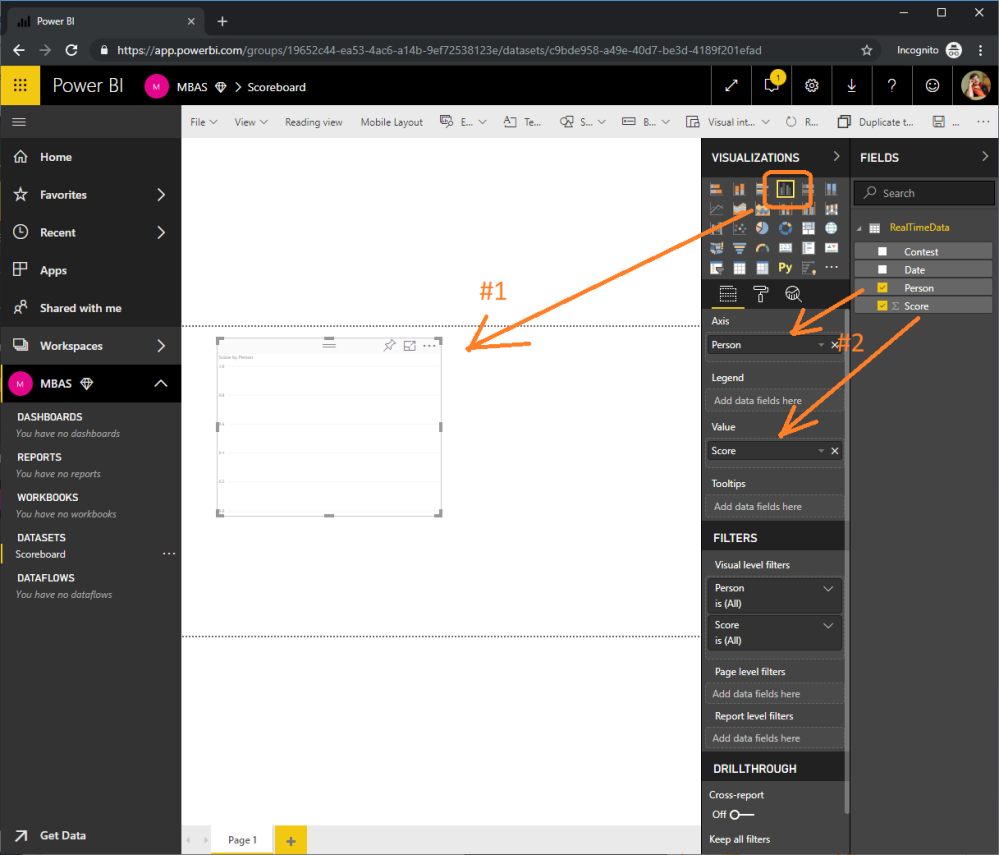
Step 7. Add a visual to display the score by Person
Drag the Score field to the Power BI report design canvas. This should default to a clustered Column chart, if not change it one and add the person as the axis.
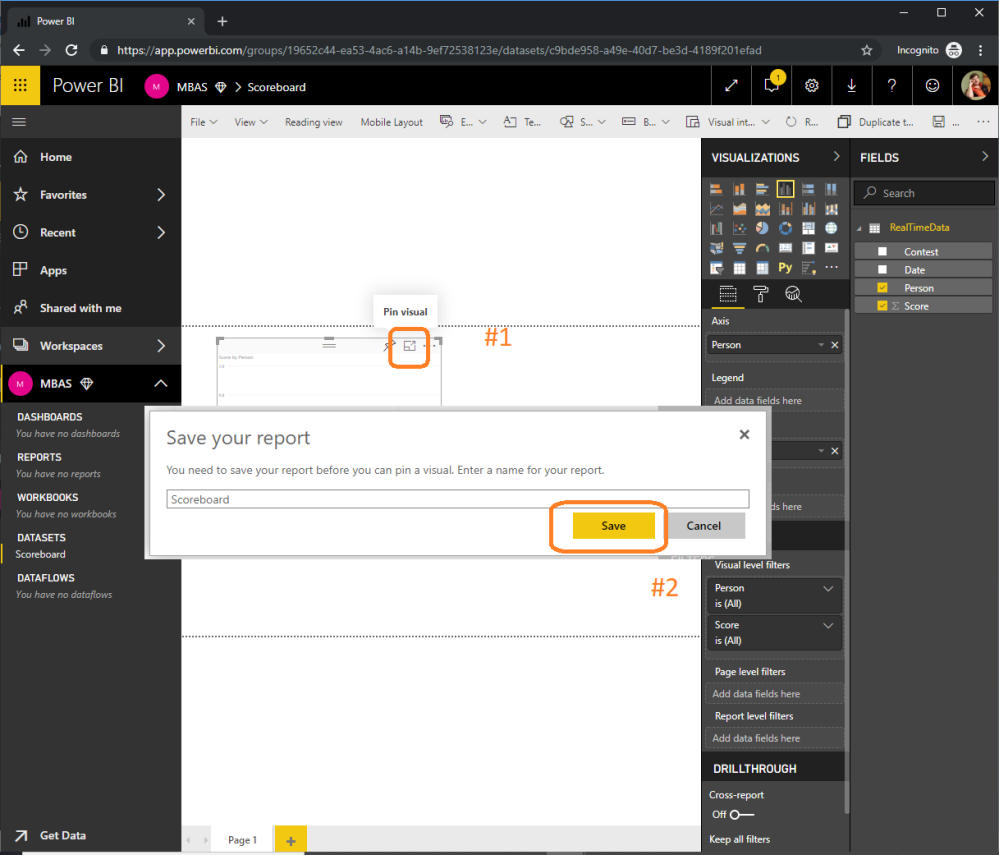
Step 8. Pin the Column Chart to a Scoreboard dashboard.
Click the push pin glyph in the visual you just created and save the report with the name “Scoreboard”
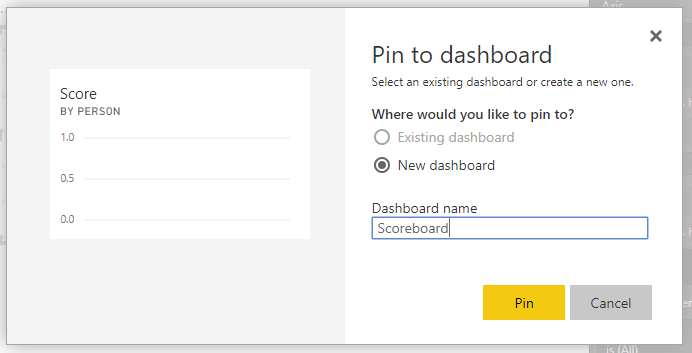
Step 9. Create a new Dashboard
Select New dashboard and give the dashboard name “Scoreboard” and click pin.
The reason for using a dashboard rather than a report is the fact that reports are not real time yet. (written 6/3/2019). Do NOT navigate to the dashboard yet.
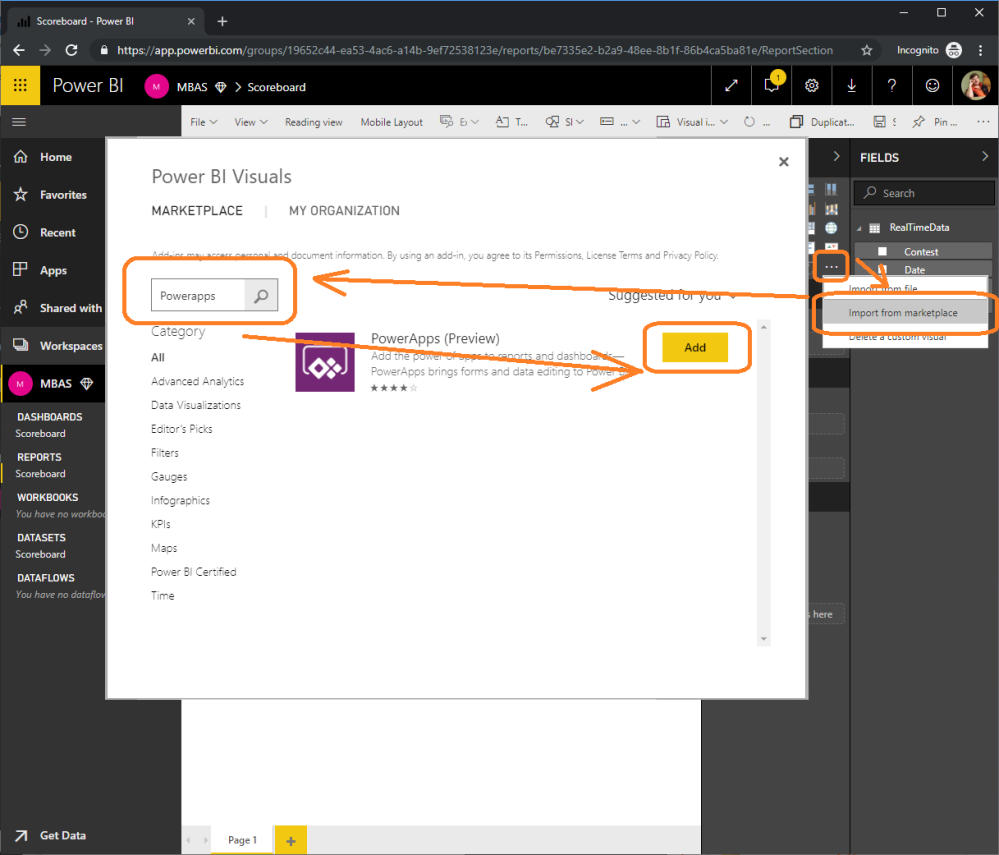
Step 10. Adding a PowerApps to the Power BI Report (using the PowerApps custom visual)
In the Power BI visuals section click the ellipsis select the “Import from marketplace”, search for PowerApps and select the visual “PowerApps (Preview)”.
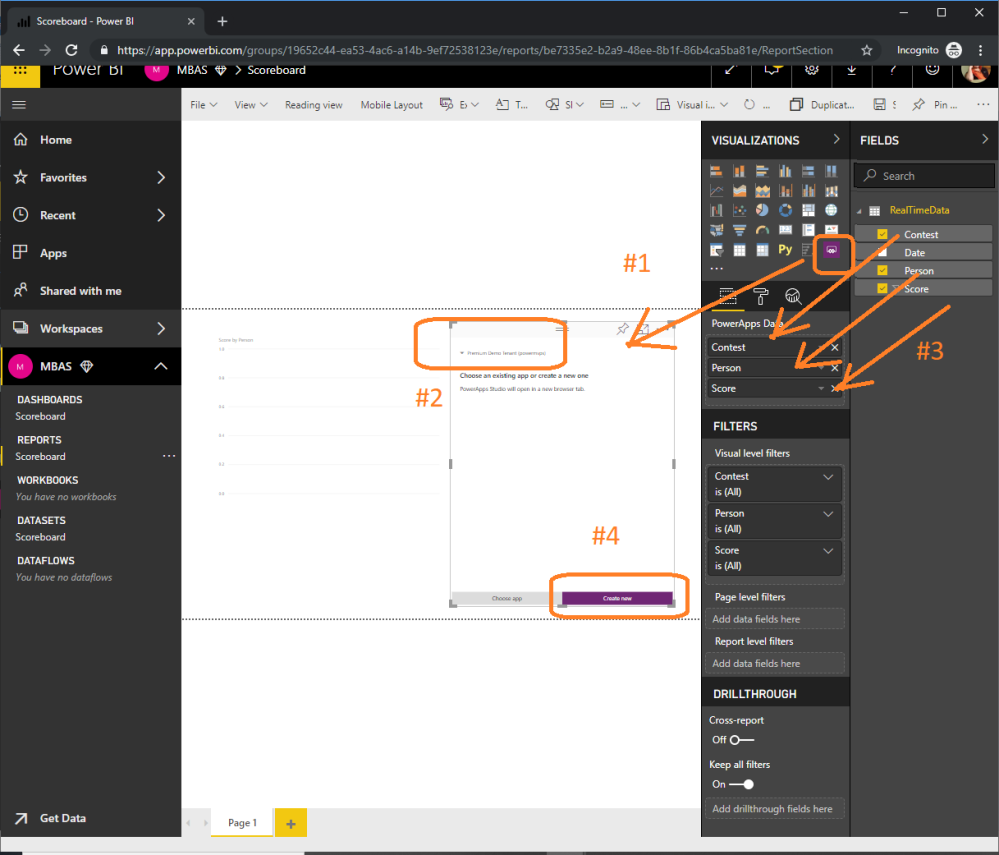
Step 11. Creating the PowerApps application with the Power BI custom visual.
Drag the fields Contest, Person and Score to the PowerApps custom visual.
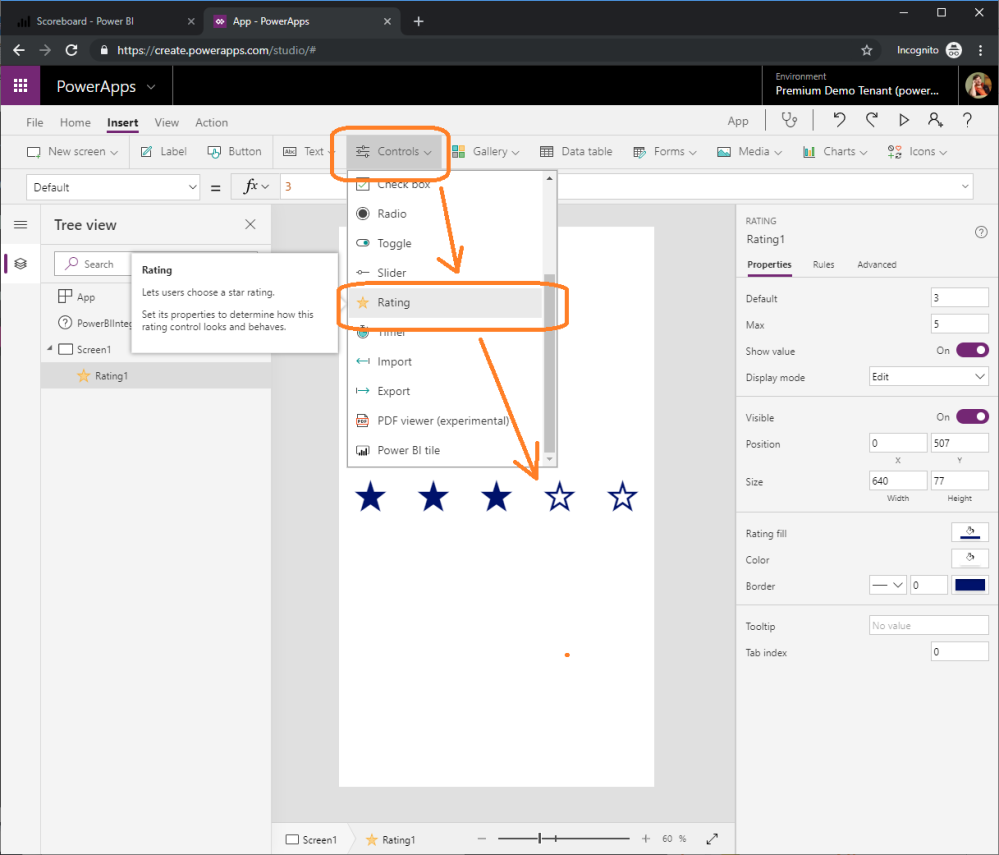
Step 12. Add a Rating control to the PowerApps application
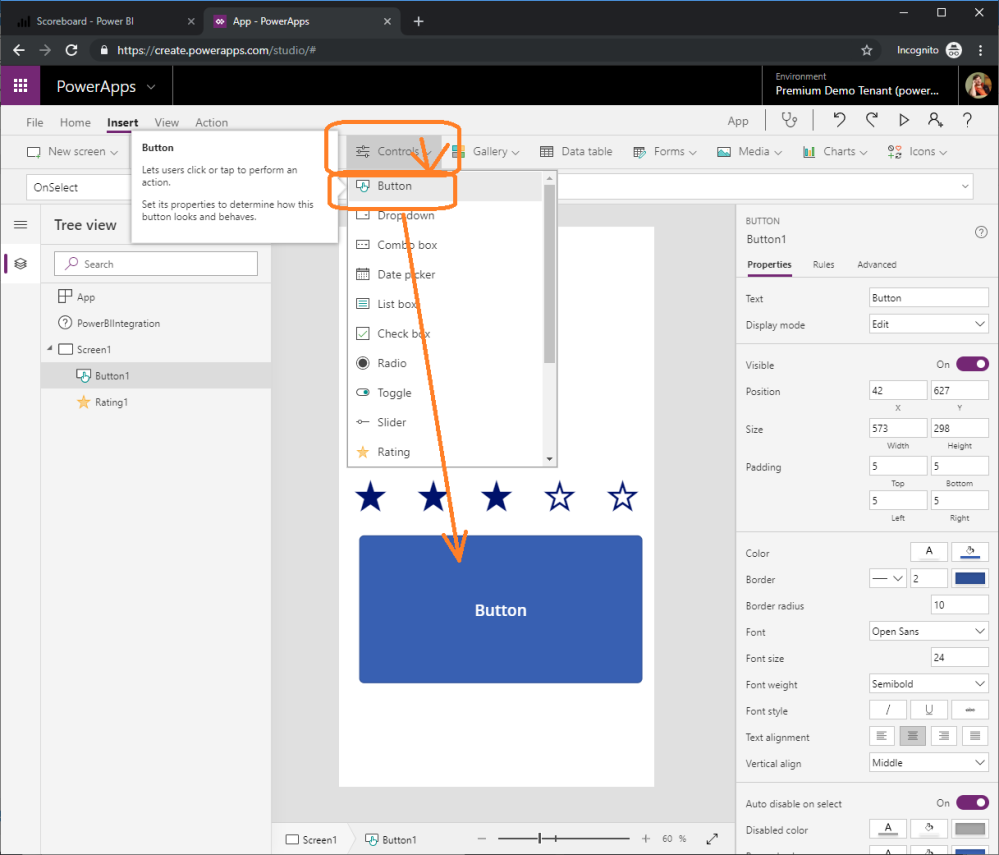
Step 13. Add a Button control to the PowerApps application
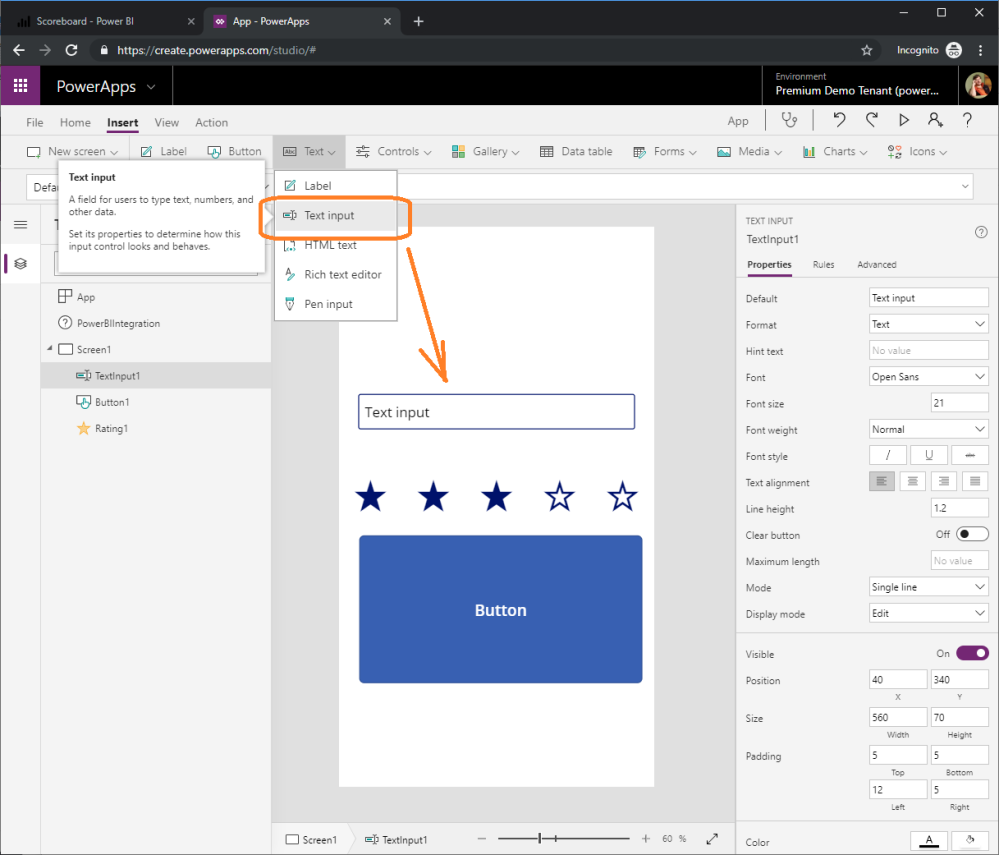
Step 14. Add a Text Input control to the PowerApps application
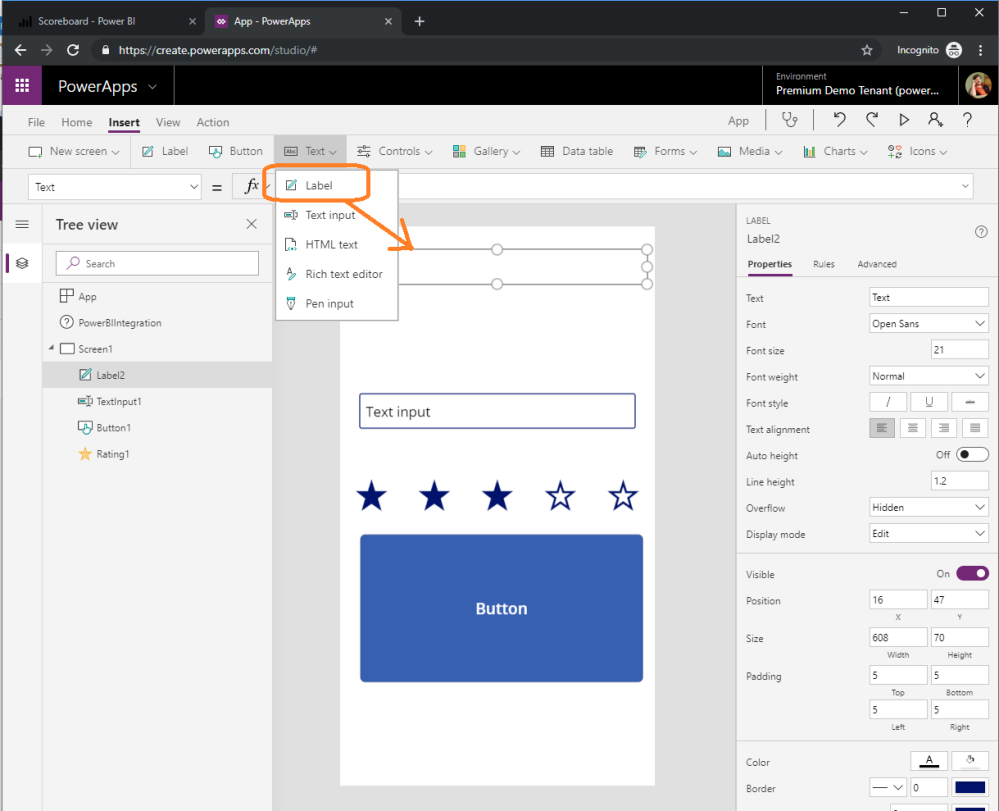
Step 15. Add a Label control to the PowerApps application
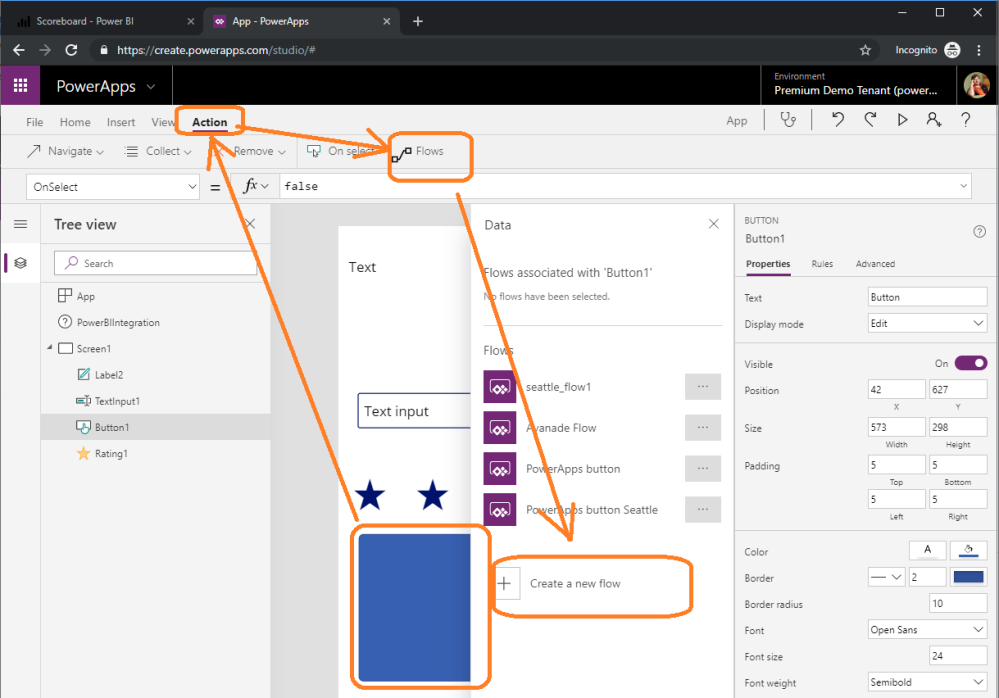
Step 16. Creating a new Flow and attaching it to the PowerApps button
Step 17. Add the Power BI Action to the Flow
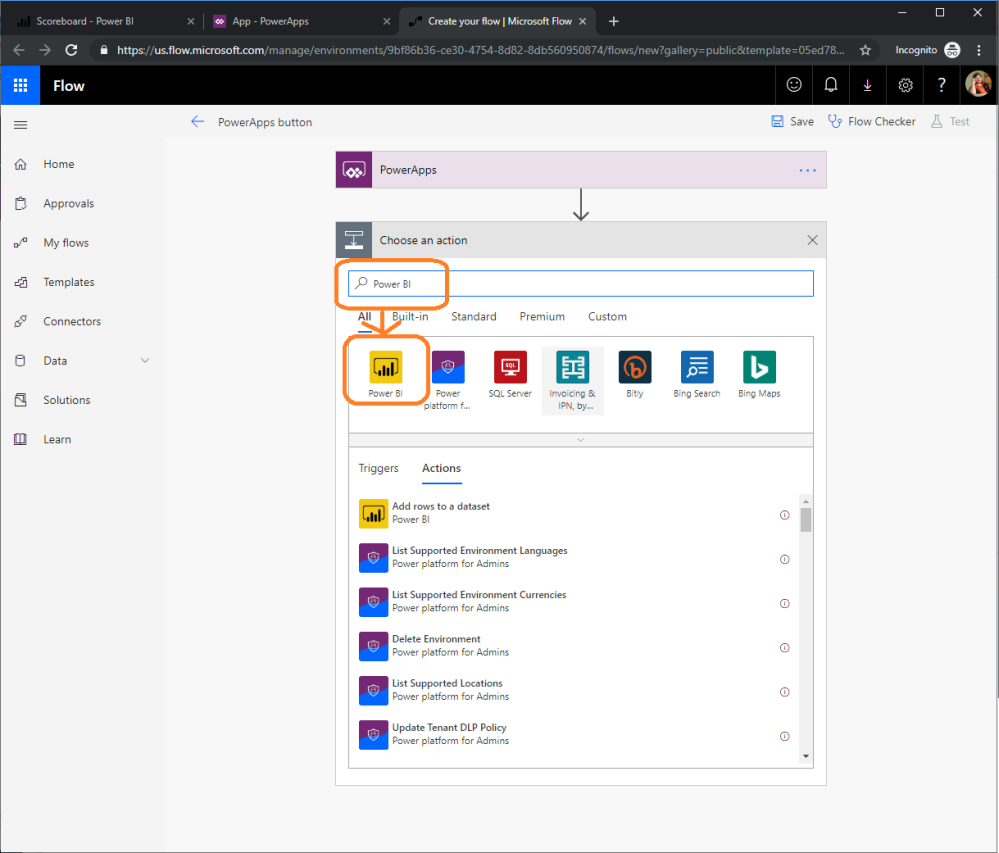
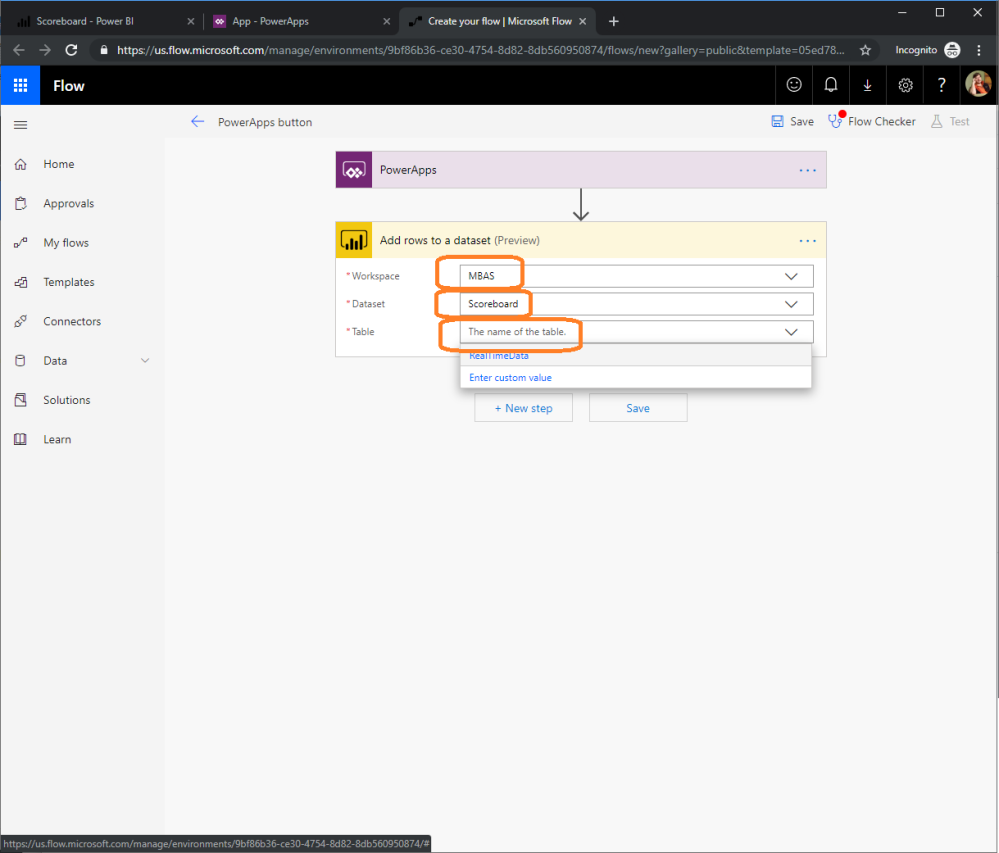
Step 17. Add the Power BI action to the Flow.
Set the workspace to the workspace you created in step one i.e. MBAS####.
Set the dataset to “Scoreboard” that you created in step #5.
The table will be called “Real Time Data” (this set automatically)
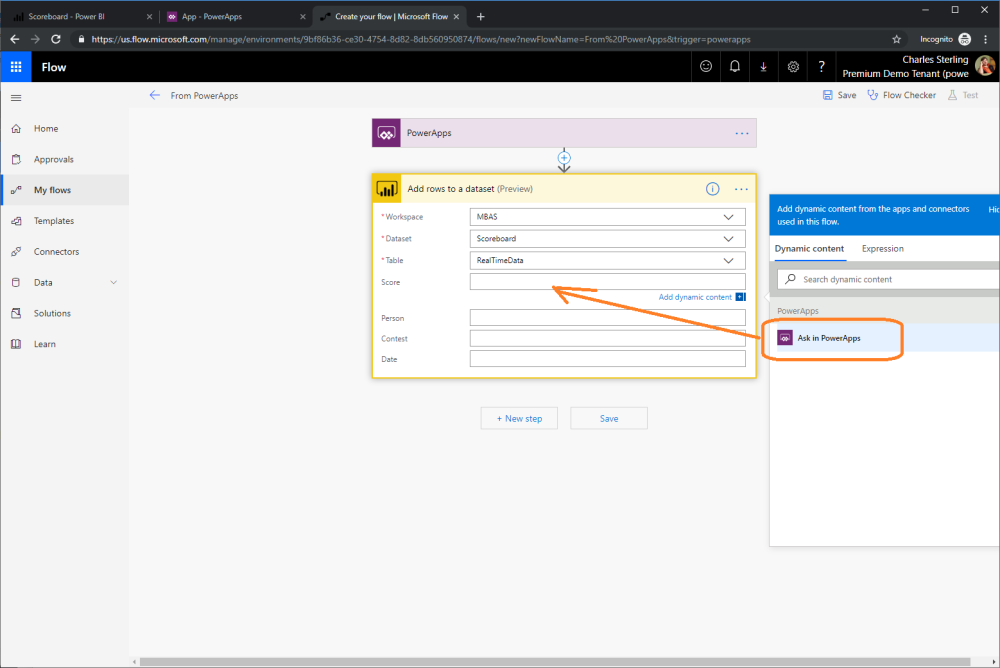
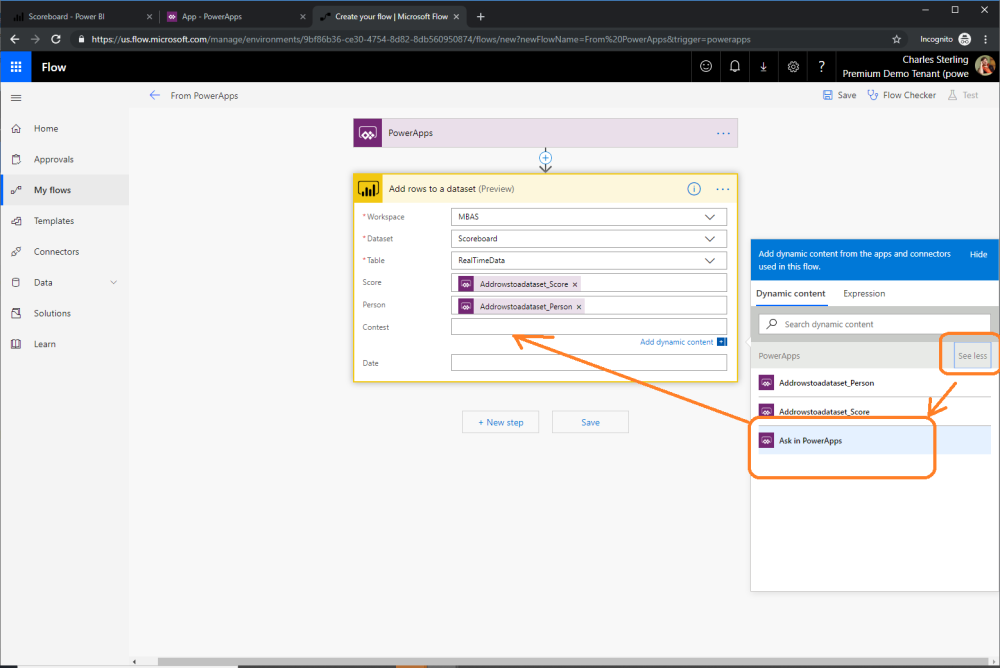
Step 18. Set every field to “Ask in PowerApps”
Set every field every field in your dataset to “Ask in PowerApps. For the first field you will see this option by default. For subsequent fields you will need to click the “See More” option.
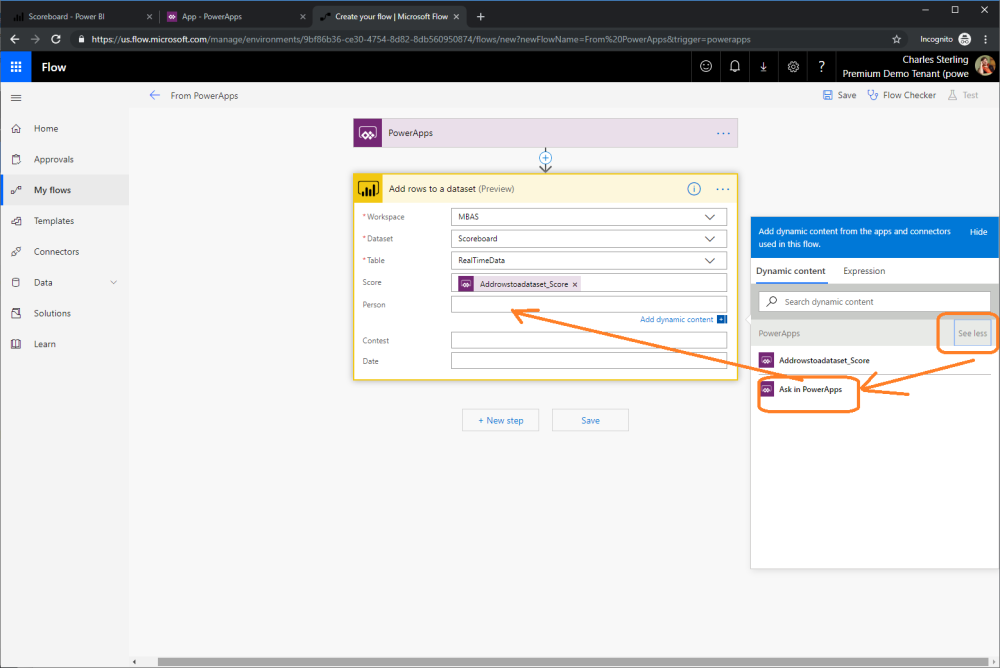
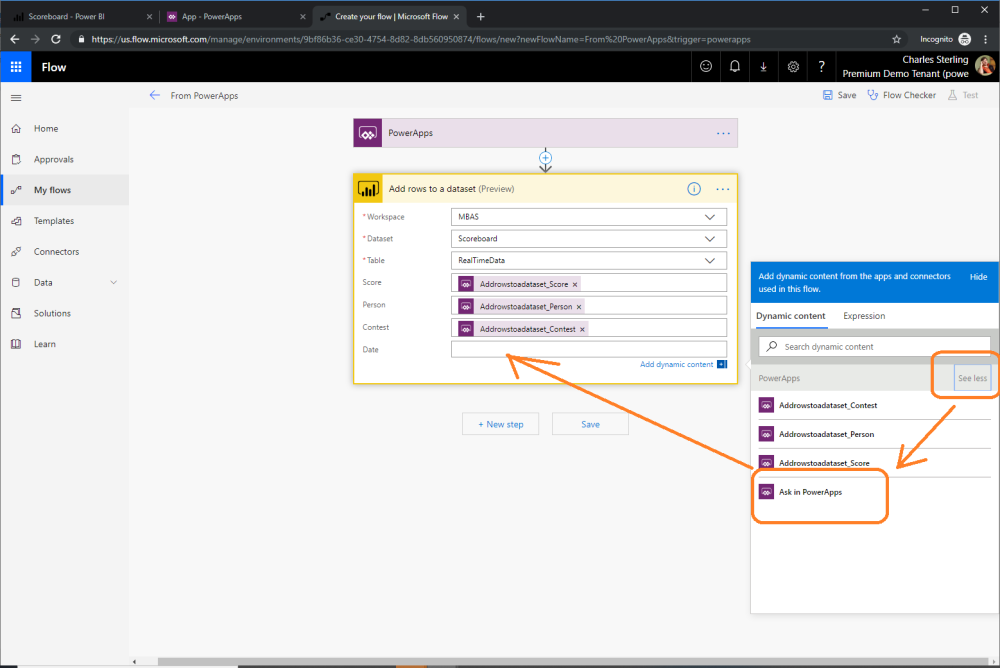
Step 19. Set every field to “Ask in PowerApps”
Set every field every field in your dataset to “Ask in PowerApps. For the first field you will see this option by default. For subsequent fields you will need to click the “See More” option. In this image that option has been set and now shows “See Less”
Step 20. Set every field to “Ask in PowerApps”
Set every field every field in your dataset to “Ask in PowerApps. For the first field you will see this option by default. For subsequent fields you will need to click the “See More” option. In this image that option has been set and now shows “See Less”
Step 21. Set every field to “Ask in PowerApps”
Set every field every field in your dataset to “Ask in PowerApps. For the first field you will see this option by default. For subsequent fields you will need to click the “See More” option. In this image that option has been set and now shows “See Less”
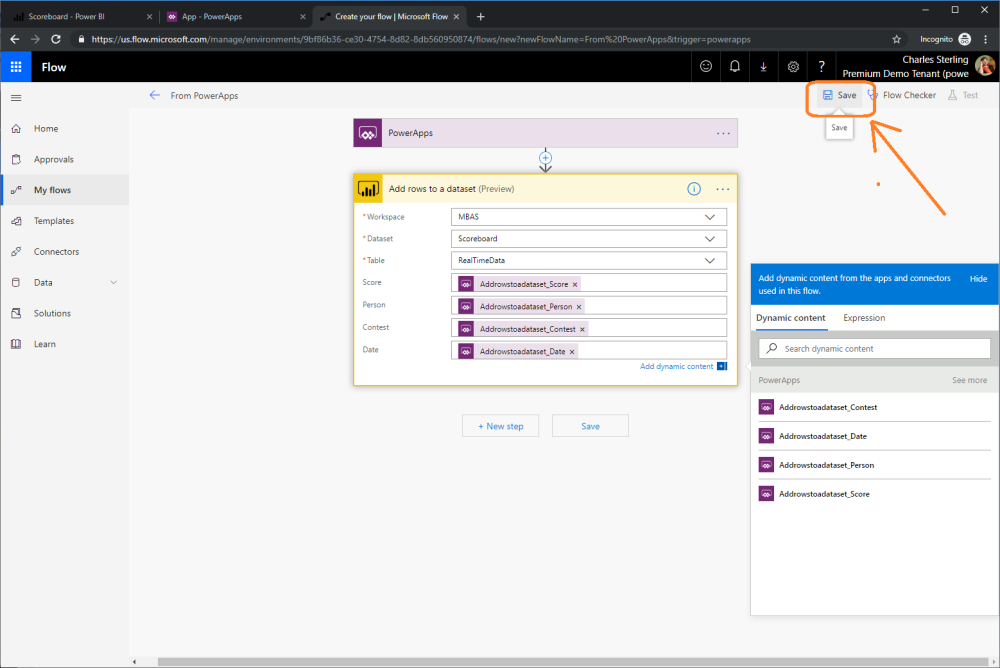
Step 22. Save your Flow
Now save your Flow. While not done in this screen shot it is recommended that you name your Flow by default called “from PowerApps” before saving.
Step 23. Connect your button to the Flow
Navigate back to the PowerApps tab and select the Flow you have saved in the step above. This will add a parameter to the Flow call for every field in the streaming dataset.
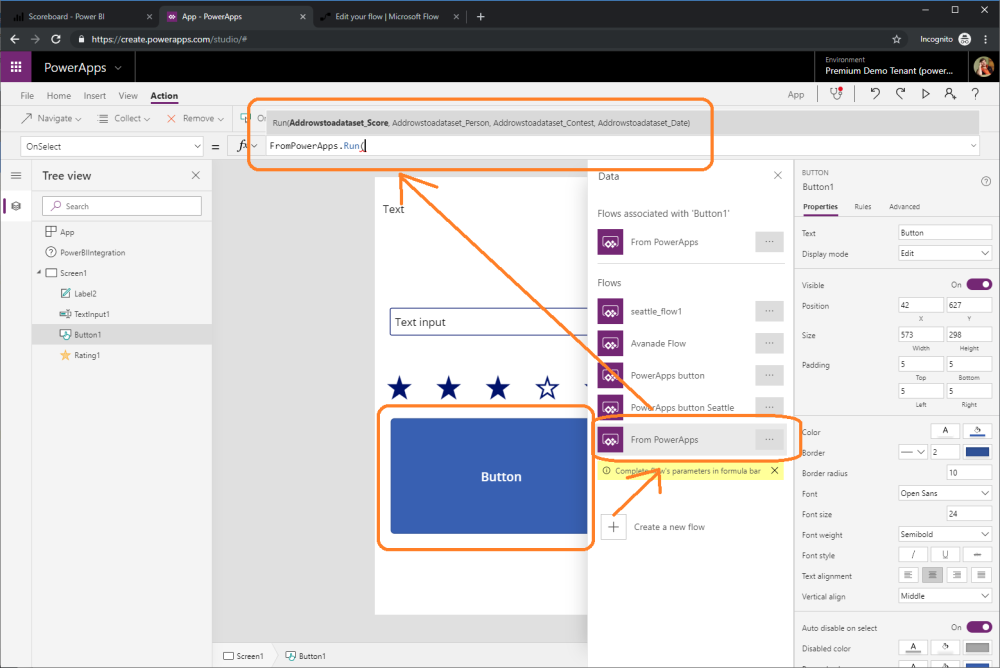
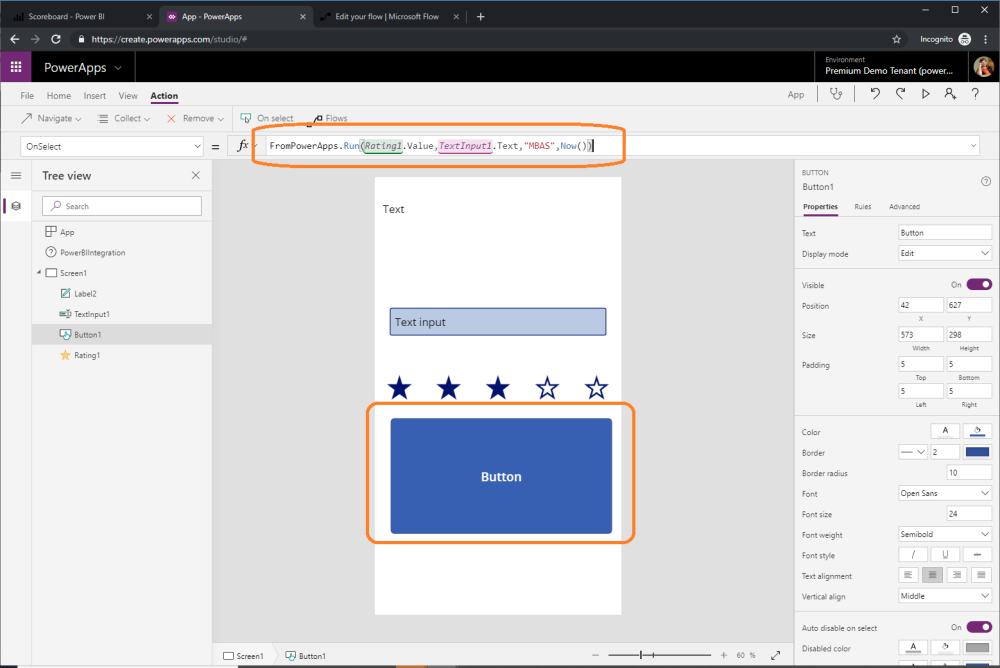
Step 24. Supply the Flow parameters
Set the score flow parameter for score to value property of the Rating1 control. Set the person parameter to the TextInput1.Text control property. Set the contest parameter to the harded coded string “MBAS”. Set the Date parameter to “Now()”.
Step 25. Save the PowerApps application
Under the file menu select “Save”
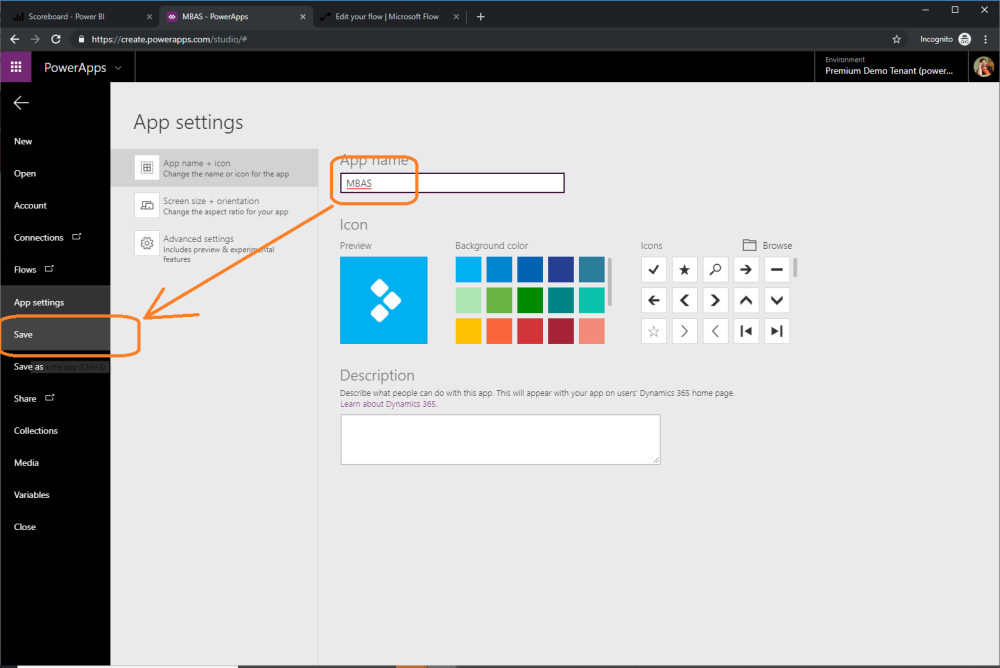
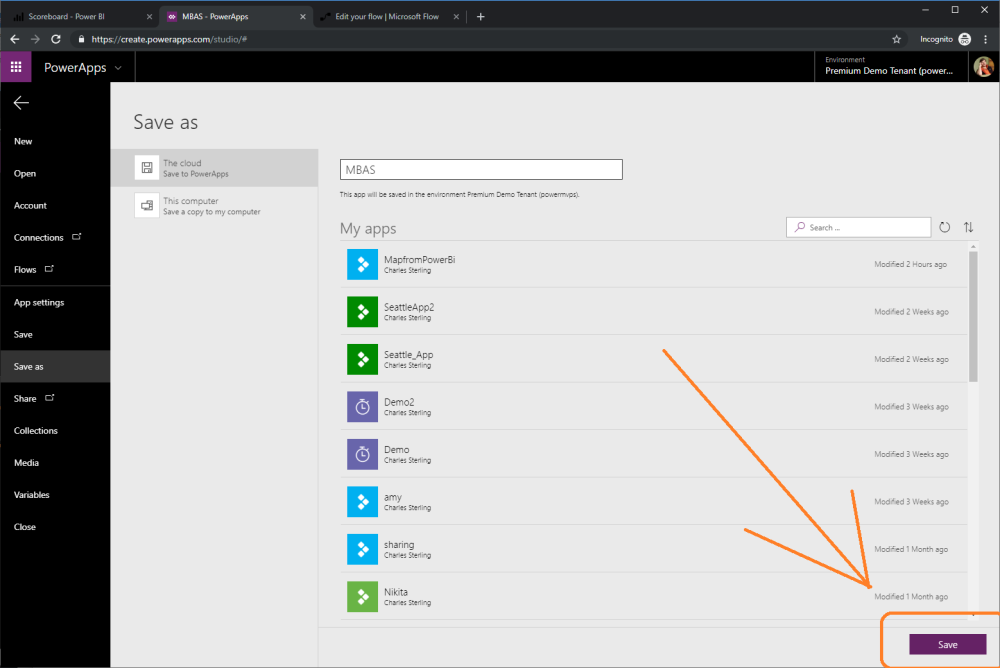
Step 26. Save the PowerApps application (cont)
Name your application and select the “Save” button in the lower right hand corner.
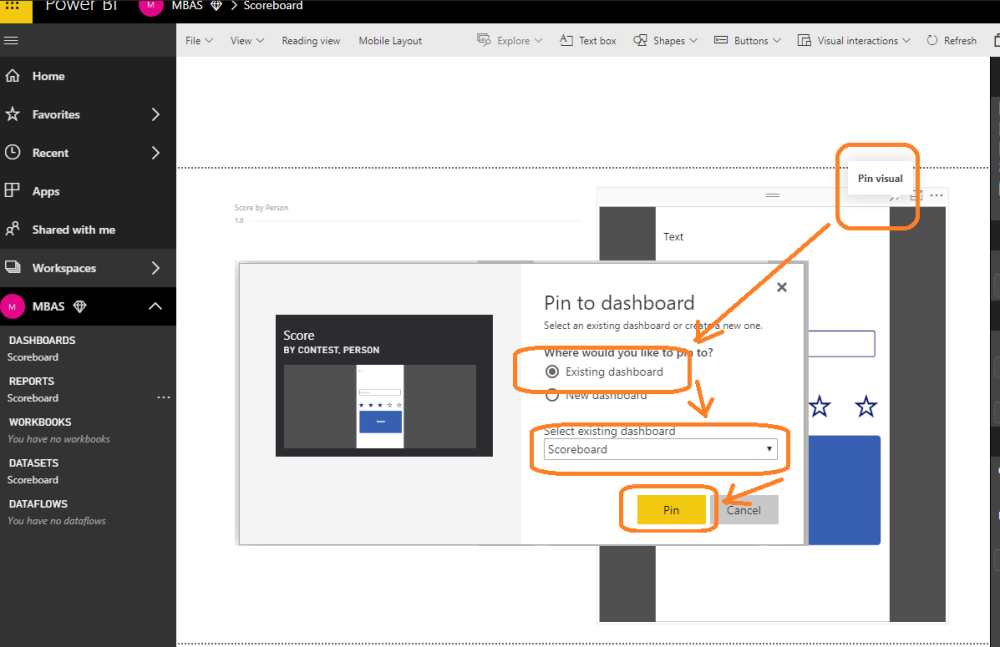
Step 27. Pin the PowerApps application to the dashboard to the Power BI Dashboard.
Navigate to the Power BI Tab. You will notice the application is already visible in the Power BI. In the upper right hand corner of the Power BI visual select “Pin visual”.
Select the “Scoreboard” dashboard created above.
Step 28. Test the PowerApps/Power BI integration .
In the Power BI Dashboard type a persons name and select a score. Hitting the button should update the column chart created above.
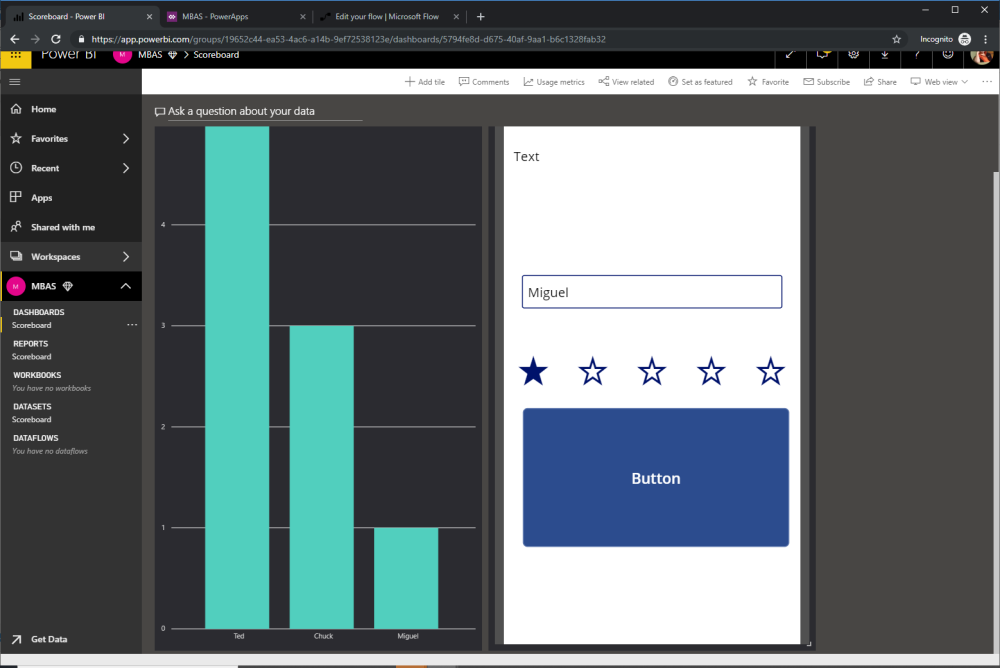
Congratulations you have created a streaming dataset, a PowerApps application and a real time dashboard!
 Amik
on:
Dynamically translate dropdown options based on a ...
Amik
on:
Dynamically translate dropdown options based on a ...
 ManishM
on:
How do you bulk download attachment files from a D...
ManishM
on:
How do you bulk download attachment files from a D...
 on:
What you should know when recruiting for a Power P...
on:
What you should know when recruiting for a Power P...
 on:
Introduction of AI Builder in Power Automate: How ...
on:
Introduction of AI Builder in Power Automate: How ...