cancel
Showing results for 
Search instead for 
Did you mean: 
Reply
menonv
Regular Visitor

Unable to display data in HTML textbox

Hi I am new to Powerapps. I have developed an app wherein data is displayed onto a HTML text box, which is within a nested galleries.

I have used nested galleries to organise my data.

The HTML box uses Concat function and picks data from three sharepoint lists. I have used several functions in the HTML box viz. Sum, Distinct, filter etc.


However I am facing some issues in displaying data. The HTML box does not display data on all ocassions. Refer attachments, one of the occassion, data for "Earthworks in Formation" was not displaying.

What could be the issue over here? How do I overcome this inconsistency ?

Thanks,

9 REPLIES 9
WarrenBelz
Most Valuable Professional

Hi @menonv ,

This first thing I would be looking at would be the actual data that is being displayed by Concat in the HTML box. A good test would be to put a label on the screen with CountRows(ThatDataSourceName) and see what that is when the HTML is not showing.

Is this a collection or directly filtered data being displayed?


v-xida-msft
Community Support
Community Support

Hi @menonv ,

Could you please share a bit more about the Concat formula you used within your app?

Are there some error message with the Concat function?


Firstly, please make sure you have filtered out these results you want to display within the Html Text control. You could consider ignore the HTML tag, just type the Concat function within the HTML Text control, then check if the expected results could be displayed.


Please also check and see if the following blog or video would help in your scenario:

https://powerapps.microsoft.com/en-us/blog/html-email-reporting-with-tabular-data/

https://www.youtube.com/watch?v=AnERfGIE8gw


Best regards,

Community Support Team _ Kris Dai
If this post helps, then please consider Accept it as the solution to help the other members find it more quickly.
WarrenBelz
Most Valuable Professional

Hi @menonv ,

A couple of options here - please tag whichever you wish to continue the thread with.

Hi @WarrenBelz ,


Thanks for your reply, I have tried your suggestion of placing a label to countrows. I do not think there is any issue in referring to the data. However the app went even more unreliable. I do not understand why that is happening

I suspect that it is because of complicated formulas that I have used within the HTML box, which could be causing this.


A simplified version of the code is as follows


Concat ( Filter from Datasource 1, Lookup Result in Datasource 1, Lookup Result in Datasource 1, Filter result in Datasource 2 and Sum, Filter Result in Datasource1 and sum, Lookup result in Datasource 3, Filter Result in Datasource 1 and sum,  Filter Result in Datasource 1 and sum, Lookup in Datasource 2) 


Any Ideas how to resolve this?,

Thanks

Code in HTML textbox

XXXX

Concat(Distinct(Filter(Project_Actual_Data, Actual_Target_Start_Date = Dte_Ref_4.Text, PROJECT_ID = Dropdown1_11.Selected.Result, MA_SEQ = ThisItem.Result, SEC_ID = Label8_3.Text),SA_SEQ),"<table><col width = 100><col width = 210><col width = 100><col width = 100><col width = 125><col width = 100><col width = 120><col width = 110><tr><td>" & Result & "</td><td>" & LookUp(Filter(Project_Actual_Data, Actual_Target_Start_Date = Dte_Ref_4.Text, PROJECT_ID = Dropdown1_11.Selected.Result, MA_SEQ = ThisItem.Result), SA_SEQ = Result,SA_Title)&"</td><td>" & LookUp(Filter(Project_Actual_Data, Actual_Target_Start_Date = Dte_Ref_4.Text, PROJECT_ID = Dropdown1_11.Selected.Result, MA_SEQ = ThisItem.Result), SA_SEQ = Result,SA_Unit)&"</td><td>" & Sum(Filter(Project_Scope_Data, SA_SEQ = Result, PROJECT_ID = Dropdown1_11.Selected.Result, SEC_ID =Label8_3.Text ), Scope_Work_Quantity)&"</td><td>" & Text(Sum(Filter(AddColumns(Filter(Project_Actual_Data, SEC_ID = Label8_3.Text, SA_SEQ = Result, PROJECT_ID = Dropdown1_11.Selected.Result), "S_Month", Month(Actual_Target_Start_Date), "S_Year", Year(Actual_Target_Start_Date),"S_Day", Day(Actual_Target_Start_Date)), Date(S_Year,S_Month,S_Day)<= Dropdown1_10.Selected.Result), Actual_Work_Quantity),"#")
& "</td><td>" & LookUp(Filter(AddColumns(Filter(Project_Agreed_Data, SEC_ID = Label8_3.Text,SA_SEQ = Result),"A_Month", Month(Agreed_Target_Start_Date), "A_Year", Year(Agreed_Target_Start_Date)), A_Year = Year(Dropdown1_10.Selected.Result), A_Month = Month(Dropdown1_10.Selected.Result)), SA_SEQ = Result,Agreed_Work_Quantity) & "</td><td>" & Sum(Filter(Project_Actual_Data, SEC_ID = Label8_3.Text, SA_SEQ = Result, PROJECT_ID = Dropdown1_11.Selected.Result, Actual_Target_Start_Date = Dte_Ref_4.Text), Actual_Work_Quantity) & "</td><td>" &
Sum(Filter(AddColumns(Filter(Project_Actual_Data, SEC_ID = Label8_3.Text, SA_SEQ = Result, PROJECT_ID = Dropdown1_11.Selected.Result), "P_Month", Month(Actual_Target_Start_Date), "P_Year", Year(Actual_Target_Start_Date), "P_Date", Day(Actual_Target_Start_Date)), P_Month = Month(Dropdown1_10.Selected.Result), P_Year = Year(Dropdown1_10.Selected.Result), P_Date <= Day(Dropdown1_10.Selected.Result)),Actual_Work_Quantity) &"</td><td>" &
Text(Day(LookUp(Filter(Project_Scope_Data, SEC_ID = Label8_3.Text), SA_SEQ = Result, PDC_End_Date)),"0#") & "-" &
Text(Month(LookUp(Filter(Project_Scope_Data, SEC_ID = Label8_3.Text), SA_SEQ = Result, PDC_End_Date)),"0#") & "-" &
Right(Text(Year(LookUp(Filter(Project_Scope_Data, SEC_ID = Label8_3.Text), SA_SEQ = Result, PDC_End_Date))),2)
&" </td></tr>")
 
XXXXX

Thanks @v-xida-msft for your reply,


I do not think here is any problem in the formula that I have used, as it has worked on several occasions, it is just that sometimes, for some of the HTML boxes( HTML box in a nested gallery), the data is not being displayed. For eg - refer attached pic. One one occasion data for "Earthworks in Formation" disappeared. after I changed the dates a couple of times, it again reappeared.


Disappearing data in HTML boxes is random, at times all data is displayed, while on other occasions one or two nested galleries do not show data in the HTML text boxes


There are though two warnings in the HTML Box

1. I am delegating filter for dates, even though there is error , the app is working

2. Sum function - there is a warning that it might not work for large data sets - Which is not an issue as I am limiting dataset through filters.


A simplified version of the code is as follows

Concat ( Filter from Datasource 1, Lookup Result in Datasource 1, Lookup Result in Datasource 1, Filter result in Datasource 2 and Sum, Filter Result in Datasource1 and sum, Lookup result in Datasource 3, Filter Result in Datasource 1 and sum, Filter Result in Datasource 1 and sum, Lookup in Datasource 2)

Code in HTML textbox
XXXX
Concat(Distinct(Filter(Project_Actual_Data, Actual_Target_Start_Date = Dte_Ref_4.Text, PROJECT_ID = Dropdown1_11.Selected.Result, MA_SEQ = ThisItem.Result, SEC_ID = Label8_3.Text),SA_SEQ),"<table><col width = 100><col width = 210><col width = 100><col width = 100><col width = 125><col width = 100><col width = 120><col width = 110><tr><td>" & Result & "</td><td>" & LookUp(Filter(Project_Actual_Data, Actual_Target_Start_Date = Dte_Ref_4.Text, PROJECT_ID = Dropdown1_11.Selected.Result, MA_SEQ = ThisItem.Result), SA_SEQ = Result,SA_Title)&"</td><td>" & LookUp(Filter(Project_Actual_Data, Actual_Target_Start_Date = Dte_Ref_4.Text, PROJECT_ID = Dropdown1_11.Selected.Result, MA_SEQ = ThisItem.Result), SA_SEQ = Result,SA_Unit)&"</td><td>" & Sum(Filter(Project_Scope_Data, SA_SEQ = Result, PROJECT_ID = Dropdown1_11.Selected.Result, SEC_ID =Label8_3.Text ), Scope_Work_Quantity)&"</td><td>" & Text(Sum(Filter(AddColumns(Filter(Project_Actual_Data, SEC_ID = Label8_3.Text, SA_SEQ = Result, PROJECT_ID = Dropdown1_11.Selected.Result), "S_Month", Month(Actual_Target_Start_Date), "S_Year", Year(Actual_Target_Start_Date),"S_Day", Day(Actual_Target_Start_Date)), Date(S_Year,S_Month,S_Day)<= Dropdown1_10.Selected.Result), Actual_Work_Quantity),"#")
& "</td><td>" & LookUp(Filter(AddColumns(Filter(Project_Agreed_Data, SEC_ID = Label8_3.Text,SA_SEQ = Result),"A_Month", Month(Agreed_Target_Start_Date), "A_Year", Year(Agreed_Target_Start_Date)), A_Year = Year(Dropdown1_10.Selected.Result), A_Month = Month(Dropdown1_10.Selected.Result)), SA_SEQ = Result,Agreed_Work_Quantity) & "</td><td>" & Sum(Filter(Project_Actual_Data, SEC_ID = Label8_3.Text, SA_SEQ = Result, PROJECT_ID = Dropdown1_11.Selected.Result, Actual_Target_Start_Date = Dte_Ref_4.Text), Actual_Work_Quantity) & "</td><td>" &
Sum(Filter(AddColumns(Filter(Project_Actual_Data, SEC_ID = Label8_3.Text, SA_SEQ = Result, PROJECT_ID = Dropdown1_11.Selected.Result), "P_Month", Month(Actual_Target_Start_Date), "P_Year", Year(Actual_Target_Start_Date), "P_Date", Day(Actual_Target_Start_Date)), P_Month = Month(Dropdown1_10.Selected.Result), P_Year = Year(Dropdown1_10.Selected.Result), P_Date <= Day(Dropdown1_10.Selected.Result)),Actual_Work_Quantity) &"</td><td>" &
Text(Day(LookUp(Filter(Project_Scope_Data, SEC_ID = Label8_3.Text), SA_SEQ = Result, PDC_End_Date)),"0#") & "-" &
Text(Month(LookUp(Filter(Project_Scope_Data, SEC_ID = Label8_3.Text), SA_SEQ = Result, PDC_End_Date)),"0#") & "-" &
Right(Text(Year(LookUp(Filter(Project_Scope_Data, SEC_ID = Label8_3.Text), SA_SEQ = Result, PDC_End_Date))),2)
&" </td></tr>")

XXXXX

WarrenBelz
Most Valuable Professional

Hi @menonv ,

Firstly, I have parsed it below and am in admiration that you actually got this to render, but also astounded that it actually did render in a HTML box.

Seriously, the first thing I would do if you have not already is Collect everything you are referring to and filter the collections. I am a bracket out somewhere below.

Concat(
   Distinct(
      Filter(
         Project_Actual_Data, 
         Actual_Target_Start_Date = Dte_Ref_4.Text, 
         PROJECT_ID = Dropdown1_11.Selected.Result, 
         MA_SEQ = ThisItem.Result, 
         SEC_ID = Label8_3.Text
      ),
      SA_SEQ
   ),
   "<table>
   <col width = 100><col width = 210><col width = 100><col width = 100><col width = 125><col width = 100><col width = 120><col width = 110><tr><td>" & 
   Result & "</td><td>" & 
   LookUp(
      Filter(
         Project_Actual_Data, 
         Actual_Target_Start_Date = Dte_Ref_4.Text, 
         PROJECT_ID = Dropdown1_11.Selected.Result, 
         MA_SEQ = ThisItem.Result
      ), 
      SA_SEQ = Result,
      SA_Title
   )&
   "</td><td>" & 
   LookUp(
       Filter(
          Project_Actual_Data, 
          Actual_Target_Start_Date = Dte_Ref_4.Text, 
          PROJECT_ID = Dropdown1_11.Selected.Result, 
          MA_SEQ = ThisItem.Result
      ), 
       SA_SEQ = Result,
       SA_Unit
   )&
   "</td><td>" & 
   Sum(
      Filter(
         Project_Scope_Data, 
         SA_SEQ = Result, 
         PROJECT_ID = Dropdown1_11.Selected.Result, 
         SEC_ID =Label8_3.Text 
      ), 
      Scope_Work_Quantity
   )&
   "</td><td>" & 
   Text(
      Sum(
         Filter(
            AddColumns(
               Filter(
                  Project_Actual_Data, 
                  SEC_ID = Label8_3.Text, 
                  SA_SEQ = Result, 
                  PROJECT_ID = Dropdown1_11.Selected.Result
                ), 
                "S_Month", 
                Month(
                   Actual_Target_Start_Date
                ), 
                "S_Year", 
                Year(
                   Actual_Target_Start_Date
                ),
                "S_Day", 
                   Day(
                      Actual_Target_Start_Date
                   )
                ), 
                Date(
                   S_Year,
                   S_Month,
                   S_Day
                )<= 
                Dropdown1_10.Selected.Result
             ), 
             Actual_Work_Quantity
          ),
          "#"
       )& 
       "</td><td>" & 
       LookUp(
          Filter(
             AddColumns(
                Filter(
                   Project_Agreed_Data, 
                   SEC_ID = Label8_3.Text,
                   SA_SEQ = Result
                ),
                "A_Month", 
                Month(
                   Agreed_Target_Start_Date
                ), 
                "A_Year", 
                Year(
                   Agreed_Target_Start_Date
                )
             ), 
             A_Year = 
             Year(
                Dropdown1_10.Selected.Result
             ), 
             A_Month = 
             Month(
                Dropdown1_10.Selected.Result
             )
          ), 
          SA_SEQ = Result,
          Agreed_Work_Quantity
       ) & 
       "</td><td>" & 
       Sum(
          Filter(
             Project_Actual_Data, 
             SEC_ID = Label8_3.Text, 
             SA_SEQ = Result, 
             PROJECT_ID = Dropdown1_11.Selected.Result, 
             Actual_Target_Start_Date = Dte_Ref_4.Text
          ), 
          Actual_Work_Quantity
       ) & 
       "</td><td>" &
       Sum(
          Filter(
             AddColumns(
                Filter(
                   Project_Actual_Data, 
                   SEC_ID = Label8_3.Text, 
                   SA_SEQ = Result, 
                   PROJECT_ID = Dropdown1_11.Selected.Result
                ), 
                "P_Month", 
                Month(
                   Actual_Target_Start_Date
                ), 
                "P_Year",
                Year(
                   Actual_Target_Start_Date
                ), 
                "P_Date", 
                Day(
                   Actual_Target_Start_Date
                )
             ), 
             P_Month = 
             Month(
                Dropdown1_10.Selected.Result
             ),
             P_Year =
             Year(
                Dropdown1_10.Selected.Result
             ), 
             P_Date <= 
             Day(
                Dropdown1_10.Selected.Result
             )
          ),
          Actual_Work_Quantity
      ) &
      "</td><td>" &
      Text(
          Day(
             LookUp(
                Filter(
                   Project_Scope_Data, 
                   SEC_ID = Label8_3.Text
                ), 
                SA_SEQ = Result, 
                PDC_End_Date
             )
          ),
          "0#"
      ) & 
      "-" &
      Text(
         Month(
            LookUp(
               Filter(
                  Project_Scope_Data, 
                  SEC_ID = Label8_3.Text
               ), 
               SA_SEQ = Result, 
               PDC_End_Date
            )
         ),
         "0#"
      ) & 
      "-" &
      Right(
         Text(
            Year(
               LookUp(
                  Filter(
                     Project_Scope_Data, 
                     SEC_ID = Label8_3.Text
                  ), 
                  SA_SEQ = Result, 
                  PDC_End_Date
               )
            )
         ),
         2
      )
      &" 
      </td></tr>"
    )

Hi @WarrenBelz 

To clarify, rendering in HTML box is an issue?


About using collections, the datasources I am using has more than 500 entries. I am using filters to limit the data I am calling from the datasource. For eg the section "S01" and "S02" may have more than 500 entries. 

Especially "Total Progress" and "Progress for Month" would have several entries - currently I am limiting them by using filters

( For eg I am filtering out all entries for Earthwork(Filling) and summing it up)


Which formula according to you would be creating the most problems?


Additionally, I am not very sure how to use collections in a nested gallery, and how to use collections when there are large number of entries in the sharepoint list.


Currently I am using the following logic in my app,


1. Use distinct function for the gallery to find all the relevant sections in a "Project" for a "Date'

2. Use a nested gallery and again use distinct function to find all the relevant "Main activities" performed during the day.

3. Use concat within the HTML box to display all the relevant data for each "Sub Activity"


Additional Info : I cannot change the datasource.


Thanks!!!


P.S there is no issue with bracket, must be a copy - paste mistake I made.

WarrenBelz
Most Valuable Professional

Hi @menonv ,

My comments may have been a bit flippant, but were based on a genuine concern.

One thing I have probably assumed but have not asked is your data source - I based my comments on SharePoint.

The speed of rendering queries is generally contingent on the number if individual "server calls" in a query - the number of times that a piece of code has to go back to the data source and ask for information or the capacity of the server-side processing to respond to the query.

Intermittent error such as yours can be caused by a data source not responding with the information requested.

I do a fair bit of HTML concatenated code in both emails and PDF files generated in OneDrive and try as much as possible to keep the Concat bits to collections with generally only one filter level and sort. I do all my "processing" in (at times) several levels of collections until I get the data I need.

Your code is obviously valid for the data you want, you just have to hope it works consistently for the purpose you are using it.


Hi @WarrenBelz ,


Thanks a lot for the info. It makes sense.


Let me try and rework the code so that I can move some of my datasources to collections to reduce the server calls. Hope that would resolve the issue.

I will get back to you once I do that.

Helpful resources

Announcements

Calling all User Group Leaders and Super Users! Mark Your Calendars for the next Community Ambassador Call on May 9th!

This month's Community Ambassador call is on May 9th at 9a & 3p PDT. Please keep an eye out in your private messages and Teams channels for your invitation. There are lots of exciting updates coming to the Community, and we have some exclusive opportunities to share with you! As always, we'll also review regular updates for User Groups, Super Users, and share general information about what's going on in the Community.     Be sure to register & we hope to see all of you there!

April 2024 Community Newsletter

We're pleased to share the April Community Newsletter, where we highlight the latest news, product releases, upcoming events, and the amazing work of our outstanding Community members.   If you're new to the Community, please make sure to follow the latest News & Announcements and check out the Community on LinkedIn as well! It's the best way to stay up-to-date with all the news from across Microsoft Power Platform and beyond.    COMMUNITY HIGHLIGHTS   Check out the most active community members of the last month! These hardworking members are posting regularly, answering questions, kudos, and providing top solutions in their communities. We are so thankful for each of you--keep up the great work! If you hope to see your name here next month, follow these awesome community members to see what they do!   Power AppsPower AutomateCopilot StudioPower PagesWarrenBelzDeenujialexander2523ragavanrajanLaurensMManishSolankiMattJimisonLucas001AmikcapuanodanilostephenrobertOliverRodriguestimlAndrewJManikandanSFubarmmbr1606VishnuReddy1997theMacResolutionsVishalJhaveriVictorIvanidzejsrandhawahagrua33ikExpiscornovusFGuerrero1PowerAddictgulshankhuranaANBExpiscornovusprathyooSpongYeNived_Nambiardeeksha15795apangelesGochixgrantjenkinsvasu24Mfon   LATEST NEWS Business Applications Launch Event - On Demand In case you missed the Business Applications Launch Event, you can now catch up on all the announcements and watch the entire event on-demand inside Charles Lamanna's latest cloud blog.   This is your one stop shop for all the latest Copilot features across Power Platform and #Dynamics365, including first-hand looks at how companies such as Lenovo, Sonepar, Ford Motor Company, Omnicom and more are using these new capabilities in transformative ways. Click the image below to watch today!     Power Platform Community Conference 2024 is here! It's time to look forward to the next installment of the Power Platform Community Conference, which takes place this year on 18-20th September 2024 at the MGM Grand in Las Vegas!   Come and be inspired by Microsoft senior thought leaders and the engineers behind the #PowerPlatform, with Charles Lamanna, Sangya Singh, Ryan Cunningham, Kim Manis, Nirav Shah, Omar Aftab and Leon Welicki already confirmed to speak. You'll also be able to learn from industry experts and Microsoft MVPs who are dedicated to bridging the gap between humanity and technology. These include the likes of Lisa Crosbie, Victor Dantas, Kristine Kolodziejski, David Yack, Daniel Christian, Miguel Félix, and Mats Necker, with many more to be announced over the coming weeks.   Click here to watch our brand-new sizzle reel for #PPCC24 or click the image below to find out more about registration. See you in Vegas!     Power Up Program Announces New Video-Based Learning Hear from Principal Program Manager, Dimpi Gandhi, to discover the latest enhancements to the Microsoft #PowerUpProgram. These include a new accelerated video-based curriculum crafted with the expertise of Microsoft MVPs, Rory Neary and Charlie Phipps-Bennett. If you’d like to hear what’s coming next, click the image below to find out more!     UPCOMING EVENTS Microsoft Build - Seattle and Online - 21-23rd May 2024 Taking place on 21-23rd May 2024 both online and in Seattle, this is the perfect event to learn more about low code development, creating copilots, cloud platforms, and so much more to help you unleash the power of AI.   There's a serious wealth of talent speaking across the three days, including the likes of Satya Nadella, Amanda K. Silver, Scott Guthrie, Sarah Bird, Charles Lamanna, Miti J., Kevin Scott, Asha Sharma, Rajesh Jha, Arun Ulag, Clay Wesener, and many more.   And don't worry if you can't make it to Seattle, the event will be online and totally free to join. Click the image below to register for #MSBuild today!     European Collab Summit - Germany - 14-16th May 2024 The clock is counting down to the amazing European Collaboration Summit, which takes place in Germany May 14-16, 2024. #CollabSummit2024 is designed to provide cutting-edge insights and best practices into Power Platform, Microsoft 365, Teams, Viva, and so much more. There's a whole host of experts speakers across the three-day event, including the likes of Vesa Juvonen, Laurie Pottmeyer, Dan Holme, Mark Kashman, Dona Sarkar, Gavin Barron, Emily Mancini, Martina Grom, Ahmad Najjar, Liz Sundet, Nikki Chapple, Sara Fennah, Seb Matthews, Tobias Martin, Zoe Wilson, Fabian Williams, and many more.   Click the image below to find out more about #ECS2024 and register today!   Microsoft 365 & Power Platform Conference - Seattle - 3-7th June If you're looking to turbo boost your Power Platform skills this year, why not take a look at everything TechCon365 has to offer at the Seattle Convention Center on June 3-7, 2024.   This amazing 3-day conference (with 2 optional days of workshops) offers over 130 sessions across multiple tracks, alongside 25 workshops presented by Power Platform, Microsoft 365, Microsoft Teams, Viva, Azure, Copilot and AI experts. There's a great array of speakers, including the likes of Nirav Shah, Naomi Moneypenny, Jason Himmelstein, Heather Cook, Karuana Gatimu, Mark Kashman, Michelle Gilbert, Taiki Y., Kristi K., Nate Chamberlain, Julie Koesmarno, Daniel Glenn, Sarah Haase, Marc Windle, Amit Vasu, Joanne C Klein, Agnes Molnar, and many more.   Click the image below for more #Techcon365 intel and register today!   For more events, click the image below to visit the Microsoft Community Days website.    

Tuesday Tip | Update Your Community Profile Today!

It's time for another TUESDAY TIPS, your weekly connection with the most insightful tips and tricks that empower both newcomers and veterans in the Power Platform Community! Every Tuesday, we bring you a curated selection of the finest advice, distilled from the resources and tools in the Community. Whether you’re a seasoned member or just getting started, Tuesday Tips are the perfect compass guiding you across the dynamic landscape of the Power Platform Community.   We're excited to announce that updating your community profile has never been easier! Keeping your profile up to date is essential for staying connected and engaged with the community.   Check out the following Support Articles with these topics: Accessing Your Community ProfileRetrieving Your Profile URLUpdating Your Community Profile Time ZoneChanging Your Community Profile Picture (Avatar)Setting Your Date Display Preferences Click on your community link for more information: Power Apps, Power Automate, Power Pages, Copilot Studio   Thank you for being an active part of our community. Your contributions make a difference! Best Regards, The Community Management Team

Hear what's next for the Power Up Program

Hear from Principal Program Manager, Dimpi Gandhi, to discover the latest enhancements to the Microsoft #PowerUpProgram, including a new accelerated video-based curriculum crafted with the expertise of Microsoft MVPs, Rory Neary and Charlie Phipps-Bennett. If you’d like to hear what’s coming next, click the link below to sign up today! https://aka.ms/PowerUp  

Tuesday Tip: Community User Groups

It's time for another TUESDAY TIPS, your weekly connection with the most insightful tips and tricks that empower both newcomers and veterans in the Power Platform Community! Every Tuesday, we bring you a curated selection of the finest advice, distilled from the resources and tools in the Community. Whether you’re a seasoned member or just getting started, Tuesday Tips are the perfect compass guiding you across the dynamic landscape of the Power Platform Community.   As our community family expands each week, we revisit our essential tools, tips, and tricks to ensure you’re well-versed in the community’s pulse. Keep an eye on the News & Announcements for your weekly Tuesday Tips—you never know what you may learn!   Today's Tip: Community User Groups and YOU Being part of, starting, or leading a User Group can have many great benefits for our community members who want to learn, share, and connect with others who are interested in the Microsoft Power Platform and the low-code revolution.   When you are part of a User Group, you discover amazing connections, learn incredible things, and build your skills. Some User Groups work in the virtual space, but many meet in physical locations, meaning you have several options when it comes to building community with people who are learning and growing together!   Some of the benefits of our Community User Groups are: Network with like-minded peers and product experts, and get in front of potential employers and clients.Learn from industry experts and influencers and make your own solutions more successful.Access exclusive community space, resources, tools, and support from Microsoft.Collaborate on projects, share best practices, and empower each other. These are just a few of the reasons why our community members love their User Groups. Don't wait. Get involved with (or maybe even start) a User Group today--just follow the tips below to get started.For current or new User Group leaders, all the information you need is here: User Group Leader Get Started GuideOnce you've kicked off your User Group, find the resources you need:  Community User Group ExperienceHave questions about our Community User Groups? Let us know! We are here to help you!

Super User of the Month | Ahmed Salih

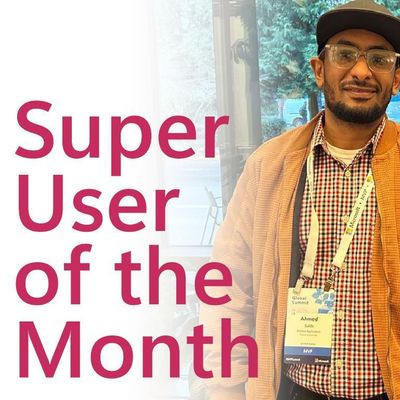
We're thrilled to announce that Ahmed Salih is our Super User of the Month for April 2024. Ahmed has been one of our most active Super Users this year--in fact, he kicked off the year in our Community with this great video reminder of why being a Super User has been so important to him!   Ahmed is the Senior Power Platform Architect at Saint Jude's Children's Research Hospital in Memphis. He's been a Super User for two seasons and is also a Microsoft MVP! He's celebrating his 3rd year being active in the Community--and he's received more than 500 kudos while authoring nearly 300 solutions. Ahmed's contributions to the Super User in Training program has been invaluable, with his most recent session with SUIT highlighting an incredible amount of best practices and tips that have helped him achieve his success.   Ahmed's infectious enthusiasm and boundless energy are a key reason why so many Community members appreciate how he brings his personality--and expertise--to every interaction. With all the solutions he provides, his willingness to help the Community learn more about Power Platform, and his sheer joy in life, we are pleased to celebrate Ahmed and all his contributions! You can find him in the Community and on LinkedIn. Congratulations, Ahmed--thank you for being a SUPER user!  

Top Solution Authors
Top Kudoed Authors
Users online (5,411)